
Cardano (ADA) falsely broke above a key resistance level, signaling that it will continue to decline in the near future.
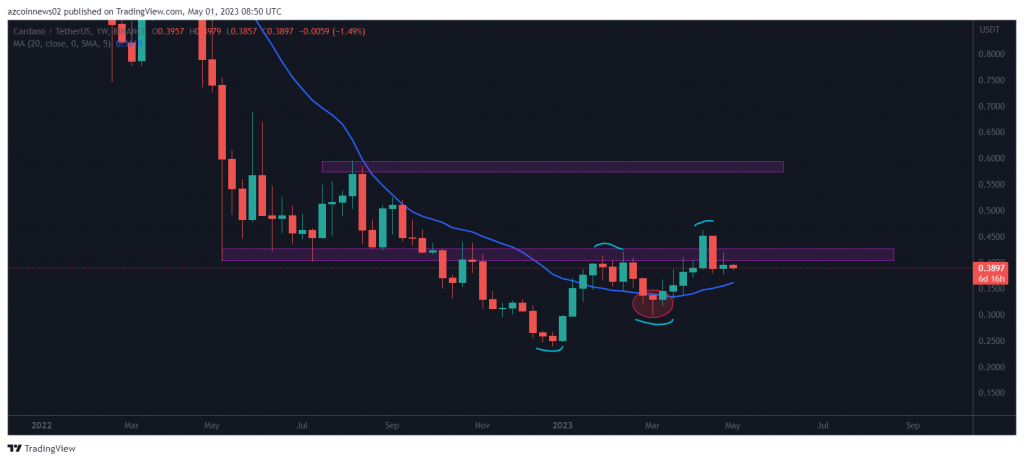
Cardano price continued to decline below the 20-week MA on November 15, 2021, after breaking below it. During this time, it hit as low as $0.24 in late December 2022 before starting the current uptrend.
This uptrend resulted in the price breaking above the 20-week MA and retesting the horizontal resistance area at $0.42. Despite the rejection, ADA successfully turned this MA as support after creating a false breakout during the week of March 6-13 (red circle). This move also helped ADA form a higher bottom that marked the end of the downtrend.
Next, Cardano price It rose rapidly and rose above the $0.42 level in the week of April 10-17, reaching a year high of $0.46. However, it faced strong selling pressure at higher levels and settled below the $0.42 area. This is a bearish signal that usually leads to more bearish. Therefore, the price of ADA could retest the 20-week MA at $0.36 once again.
However, despite this weakness, ADA price formed a higher high and a higher low. Therefore, the trend is still considered bullish until the 20-week MA is broken.
Cardano Breaks Below Emerging Parallel Channel
Cardano price broke below an ascending parallel channel and confirmed it as resistance on April 26. This indicates that the bears have taken control of the price action.
The closest support area is located at $0.38. The next important support area is at $0.34 formed by the ascending support line and the horizontal support area.
The RSI indicator declined sharply from the overbought zone and dropped below 50, supporting further declines. Therefore, ADA price is likely to drop below the $0.38 support area and decline towards the next $0.34 support area.
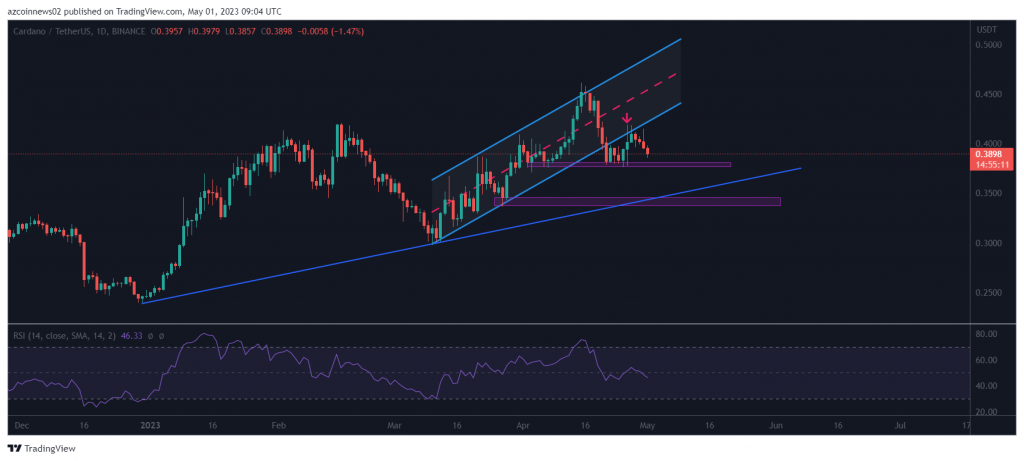
The most likely price action suggests that ADA will continue to decline in the near future. The nearest support area is at $0.38, while the next important support area is at $0.34. The trend is still considered bullish until the 20-week MA ($0.36) is broken.
You can follow the current price action here.