
Bitcoin and altcoins continue to be shaken by macroeconomic and geopolitical uncertainty. However, data shows that bulls continue to buy on every dip. What are the key resistance levels that major altcoins, including Bitcoin and AVAX Coin, must cross to signal the end of the correction phase? Crypto analyst Rakesh Upadhyay examines the charts of the top 10 cryptocurrencies to find out.
BTC, ETH, BNB, SOL and XRP Coin analysis
Bitcoin (BTC) price analysis
Bitcoin broke above the 20-day exponential moving average ($65,855) on April 22. However, the bears stopped the recovery at the 50-day simple moving average ($67,509). If the price stays below the 20-day EMA, a drop to $60,775 is possible. Buyers are expected to defend this level. Because a drop below this level could pave the way for a collapse towards $54,298. Conversely, if the price rises and breaks above the 50-day SMA, it will indicate that lower levels are attracting buyers. BTC is likely to rise to $73,777 later. Buyers will need to overcome this hurdle to push BTC to $84,000.
Ethereum (ETH) price analysis
ETH attempted to break above the 20-day EMA ($3,237) on April 24. However, the long wick on the candlestick shows that the bears are not relaxing. If the price stays below the 20-day EMA, ETH is at a risk of falling below $3,056. If this happens, it is possible for ETH to retest the critical support at $2,852. This is a vital support to pay attention to. Because a break below is likely to drop ETH to $2,700. If the price rises from the current level or $3,056 and rises above the 20-day EMA, it will indicate that the selling pressure is easing. This, in turn, is likely to push ETH towards the 50-day SMA ($3,466) and then to $3,679.

Binance Coin (BNB) price analysis
BNB is gradually moving towards $635, where the bulls are expected to face strong selling by the bears. If the price drops sharply from $63.5, it will indicate that BNB will extend its stay in the range for some more time. BNB is likely to drop to the moving averages and then to $495. If buyers want to take control, they will have to overcome the $635 hurdle. If they do so, it would indicate the start of the next leg of the bull trend towards $692 and eventually the pattern target of $775.

Solana (SOL) price analysis
SOL reached the $162 level, where the bulls are likely to face strong resistance from the bears. If the price declines sharply from $162, it would indicate that the bears are defending the level fiercely. This would leave SOL stuck between $162 and $126 for a few more days. Alternatively, if the price rises above $162, it will indicate that the correction is over. The bullish momentum may increase and SOL may attempt to rise to $205. On the downside, a decline below $126 would start a new downtrend towards $100.

Ripple (XRP) price analysis
XRP broke above the 20-day EMA ($0.54) on April 22. However, the bulls failed to sustain higher levels. The price fell sharply and broke below the 20-day EMA on April 24. This shows that the bears are active at higher levels. It is possible for XRP to drop to $0.50 and then the solid support at $0.46. If buyers want to gain the upper hand, they will need to push the price back above the 20-day EMA. This will increase the likelihood that XRP will remain in the wide range between $0.46 and $0.74 for a while.

DOGE, TON, ADA, SHIB and AVAX Coin analysis
Dogecoin (DOGE) price analysis
cryptokoin.comAs you follow from , DOGE has been trading around $0.16 for the last few days. This points to a tough battle between bulls and bears. If the price continues to decline, the bears will again try to sink DOGE to $0.13. Conversely, if the bulls push the price above the upper zone, it will signal that the correction is over. It is possible for DOGE to rise to $0.21 later. However, bears will present significant difficulty here.

Toncoin (TON) price analysis
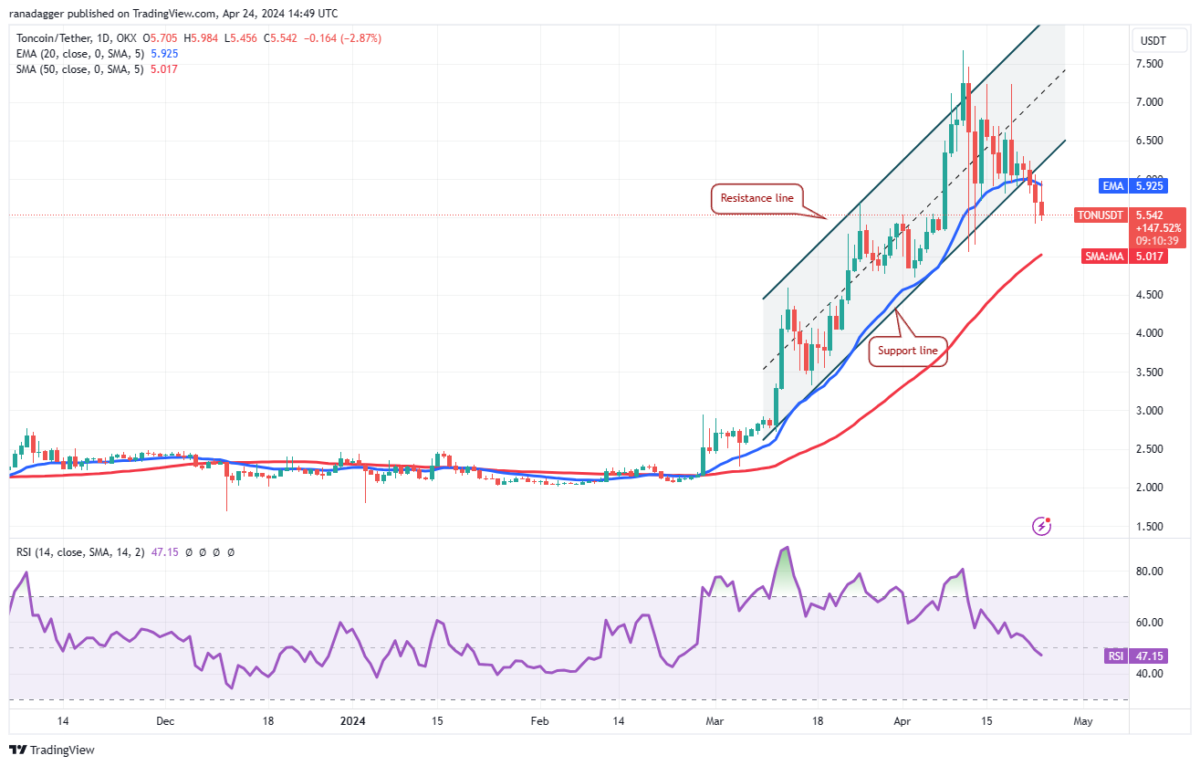
Toncoin (TON) broke below the ascending channel formation on April 22. Thus, it showed that the bull trend is probably over. The bulls will make another attempt to push the price back into the channel. If they do, this will indicate that the breakout is a bear trap. This is likely to lead to a ‘short squeeze’, pushing the price towards $7.23. Instead, if the price turns down from the breakdown level in the channel, it will indicate that the bears are trying to turn the level into resistance. Once the price drops below $5.42, selling is likely to accelerate. Thus, TON is likely to fall to the 50-day SMA ($5.01).
Cardano (ADA) price analysis
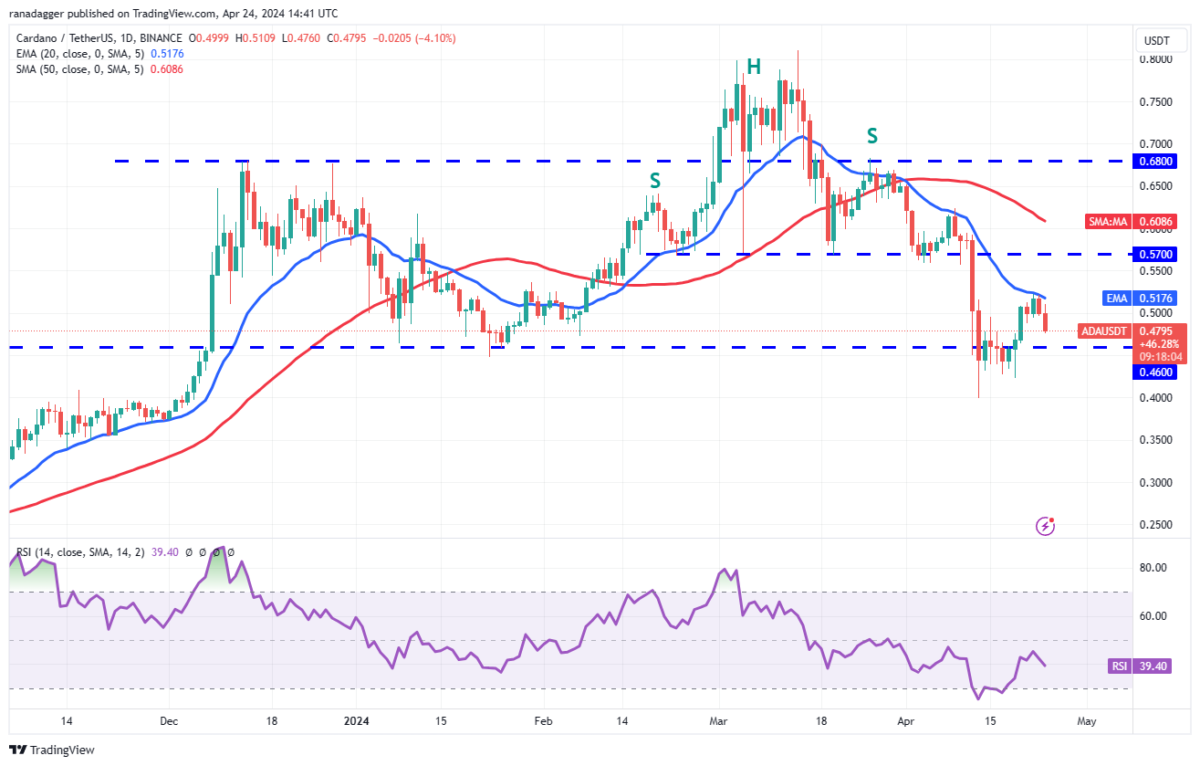
ADA’s recovery stalled at the 20-day EMA ($0.51) on April 22. This shows that the bears continue to sell at higher levels. The bears will try to push the price down to $0.46. This is an important level to pay attention to. Because if the support is cut, it is possible for ADA to drop to $0.40. The bulls are likely to defend this level strongly. Because a break below this would signal the beginning of a deeper correction towards $0.35. The first sign of strength will be a breakout and close above the 20-day EMA. If this resistance is breached, it will suggest a short-term trend change. It is possible for ADA to rise to $0.57 later.
Avalanche (AVAX Coin) price analysis
AVAX Coin price is likely to face resistance in the zone between the 20-day EMA ($40) and the $42 breakout level. A sharp decline in the price from the current level will indicate that the bears remain in command. It is possible that AVAX Coin price may decline towards the $32 to $27 support zone. Buyers will try to protect this region with all their might. Because if they fail in their efforts, it is possible that the AVAX Coin price will drop to $20. Instead, if the bulls push the AVAX Coin price above $42, it would indicate the beginning of a sustained recovery. AVAX Coin price is likely to rise to $50, where the bears will mount a strong defense again.

Shiba Inu (SHIB) price analysis
SHIB broke above the bear trend line on April 21. However, the bulls failed to break the barrier at the 50-day SMA ($0.000028). If the price breaks the 50-day SMA, it will indicate that the corrective phase will be over. It is possible for SHIB to rise as high as $0.000033. Moreover, it might attempt a rally towards the solid resistance at $0.000039 after that. Conversely, if the price drops sharply and breaks below the 20-day EMA, it will indicate that the break above the bearish trend line could be a bull trap. SHIB is likely to slide towards $0.000020 later.

To be instantly informed about the latest developments, contact us twitter‘in, Facebookin and InstagramFollow on and Telegram And YouTube Join our channel!