
According to Dan Gambardello, founder of Crypto Capital Ventures, ADA is ready for an important bull run. Analyst Lockridge Okoth says LTC will see significant gains before halving. Another analyst, Ekta Mourya, notes that LINK has entered the opportunity zone. Analyst Akash Girimath expects a 20% rally for ATOM as the altcoin price signals a buy.
ADA prepares for an important bull run
With an impressive total lock-in-value (TVL), Dan Gambardello reveals that ADA has the potential to recoup its losses from its all-time high (ATH) and climb even higher. As you follow on Kriptokoin.com, ADA reached an ATH of $3.09 on August 30, 2021. Since then the price has dropped. Currently, ADA has lost about 90% of its ATH value. At the time of this writing, ADA was priced at $0.36. Also, since the beginning of 2023, ADA has been trading between $0.24 and $0.46.
According to Gambardello, a prolonged sideways move after a significant downtrend is one of the signs for ADA’s next direction. He sees ADA’s current price behavior as a sign that the downtrend has reached the point of exhaustion and a reversal is imminent. Gambardello compares Cardano’s TVL to Ethereum’s. It evaluates the types of solutions offered by both Blockchains and Cardano’s potential to catch up with Ethereum or at least close the gap. According to him, the result supports his prediction.
Data from DeFi Llama shows that Cardano’s TVL is worth $146.61 million at the time of writing. ATH TVL is $326 million. So even though ADA’s value has dropped nearly 90%, current TVL is only 55% behind its ATH. Gambardello says the recovery in TVL reflects significant bullish momentum that will push ADA towards a new ATH in its next bull run. Gambardello points out that both Blockchains offer similar solutions. So, he believes that Cardano can match the value of Ethereum. According to him, Cardano could upset expectations by challenging Ethereum’s ATH in TVL worth $106 billion, almost 1,000 times the current Cardano TVL.
It is possible for the price of this altcoin to increase by 45% before the third halving
Litecoin (LTC) price is trading in a bullish trend with price action causing a triangle to appear on the daily chart as shown below. Altcoin price is consolidating within the triangle, while the tapering end points to diminishing volatility with a possible breakout in either direction. A breakout is confirmed by a decisive daily candlestick close above or below the technical pattern.
With that in mind, Litecoin price could move higher once it makes a decisive daily close above the resistance line of the triangle at $101.9. If this happens, it is possible for the price to break above the downtrend line. Thus, it is likely to rally the liquidity above the $115.6 resistance level before tagging the upbeat target of the triangle around $134.4. This represents a 45% rise from the current price of $93.2.
This bullish outlook has the support of the Parabolic SAR, which tracks Litecoin price from below. Also, the Relative Strength Index (RSI) supports the bullish argument after LTC called to buy when it broke above the signal line (yellow band) on May 13. Its position at 61 before the altcoin was overbought indicated more room to the upside. Therefore, it is possible for the LTC price to still rise. Notably, the 45% target is in line with the predictions of leading crypto analyst Pentoshi, who hinted that the altcoin price will rise to $138 before a potential pullback to around $92 ahead of the next LTC halving in the next 8-10 weeks.
However, even if LTC price climbs 45% to its $134.4 target, it won’t be enough to cover the losses investors have suffered in the ongoing bear market.

Conversely, if buyer momentum declines, the bears could rally the LTC market and push Litecoin price below the lower border line of the triangle formation. The bullish thesis will be invalidated if the daily candlestick closes below the lower limit at $76.0. In such a case, it is likely to drop as low as $51.1, the October low.
LINK enters the zone of opportunity
The Market Value/Actual Value ratio (MVRV), a metric that calculates the ratio between the current price and the average price of each coin/token purchased, is used to determine the potential profit or loss if the asset is sold at the current price. This helps determine how over or undervalued the asset is. Chainlink’s 30-day MVRV is less than one. This shows that most investors selling at the current price level will make a loss.
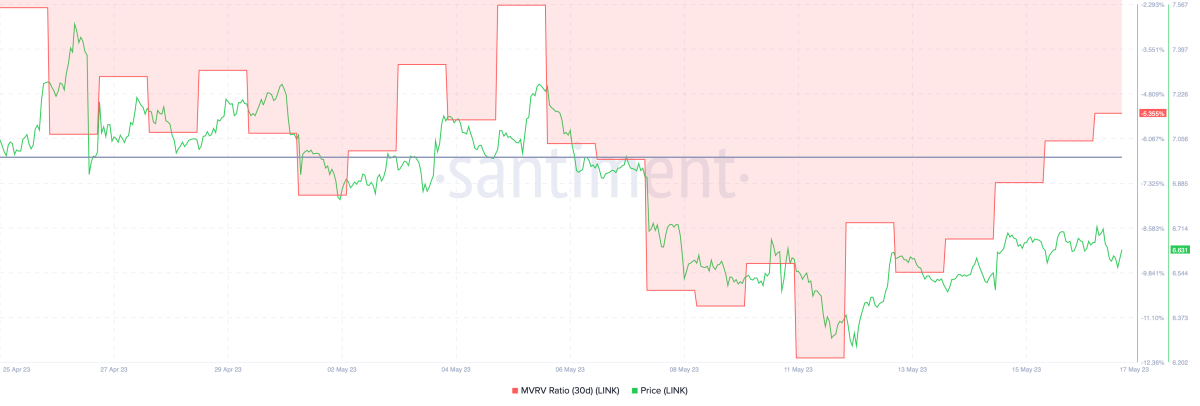
The MVRV ratio indicates that Chainlink is in the opportunity “buy” zone. Because LINK is currently undervalued with MVRV below one. Interestingly, the altcoin has slipped into the opportunity zone with a high level of development activity in the protocol.
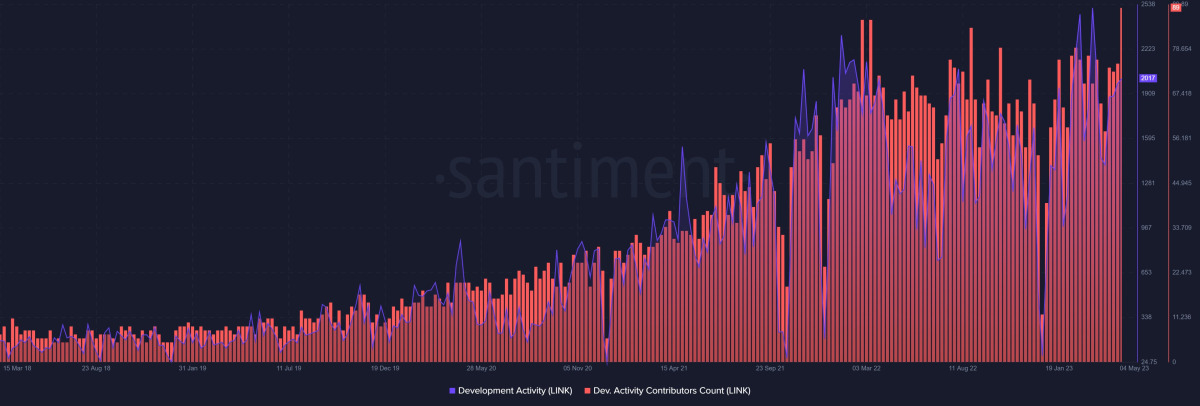
A high volume of development activity is associated with an increase in project utility, adoption and price. However, LINK has moved in the opposite direction and the asset is in the opportunity “buy” zone. Thus, it showed that the altcoin had hit the bottom of its cycle. He also signaled that he is probably ready to recover.
This altcoin price is approaching a breakout
Cosmos price has been trading in the $9.37 to $12.50 range since November 2022. ATOM bulls leaned back and tried to break out of this range in January 2023 but failed. In the past two months, the altcoin has made four low bottoms. Taking a closer look at the Relative Strength Index (RSI) and Awesome Oscillator (AO), we see that these indicators are producing higher lows. This mismatch is called “bullish bias”. It also often results in the underlying asset rising. That’s what happens with the Cosmos price in this case.
A quick recovery above $10.93, the midpoint of the range, will be the first sign of bullish confirmation. After a successful conversion of this level to a support base, altcoin price will seek a retest of the $12.50 high range followed by the $12.87 hurdle. Altogether, this move will yield an 18% gain from the current $10.83 position for traders.

On the other hand, what if the bullish divergence does not occur and the Cosmos price does not rise? This indicates that the general selling pressure is high. In such a case, the bullish thesis will be invalidated if it breaks the $10.20 support level. It is possible that such a development will cause the altcoin to slide in a low range of $9.37, down 8%.
Contact us to be instantly informed about the last minute developments. twitter‘in, Facebookin and InstagramFollow and Telegram And YouTube join our channel!
Risk Disclosure: The articles and articles on Kriptokoin.com do not constitute investment advice. Bitcoin and cryptocurrencies are high-risk assets, and you should do your due diligence and do your own research before investing in these currencies. You can lose some or all of your money by investing in Bitcoin and cryptocurrencies. Remember that your transfers and transactions are at your own risk and any losses that may occur are your responsibility. Cryptokoin.com does not recommend buying or selling any cryptocurrencies or digital assets, nor is Kriptokoin.com an investment advisor. Therefore, Kriptokoin.com and the authors of the articles on the site cannot be held responsible for your investment decisions. Readers should do their own research before taking any action regarding the company, assets or services in this article.
Disclaimer: Advertisements on Kriptokoin.com are carried out through third-party advertising channels. In addition, Kriptokoin.com also includes sponsored articles and press releases on its site. For this reason, advertising links directed from Kriptokoin.com are on the site completely independent of Kriptokoin.com’s approval, and visits and pop-ups directed by advertising links are the responsibility of the user. The advertisements on Kriptokoin.com and the pages directed by the links in the sponsored articles do not bind Kriptokoin.com in any way.
Warning: Citing the news content of Kriptokoin.com and quoting by giving a link is subject to the permission of Kriptokoin.com. No content on the site can be copied, reproduced or published on any platform without permission. Legal action will be taken against those who use the code, design, text, graphics and all other content of Kriptokoin.com in violation of intellectual property law and relevant legislation.