
Solana, a scalable blockchain network to provide decentralized finance (DeFi) solutions
Looking at the data on CoinMarketCap, the trading volume of the token has increased by 2.54% in the last 24 hours.
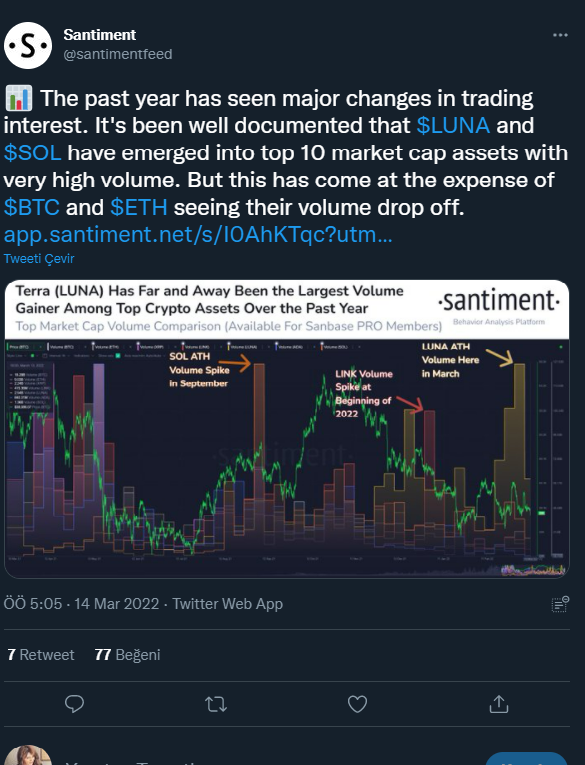
There was a 2.71% pullback in market value. In addition, when we look at the most recently published Santiment data below, we can see that there were significant volumetric increases on the Solana side, compared to the Bitcoin and Ethereum side in terms of volume in the period between the last quarter of 2021 and the first quarter of 2022.
From these data, we can determine that Solana has entered the top 10 high-volume market capitalization assets since last year.
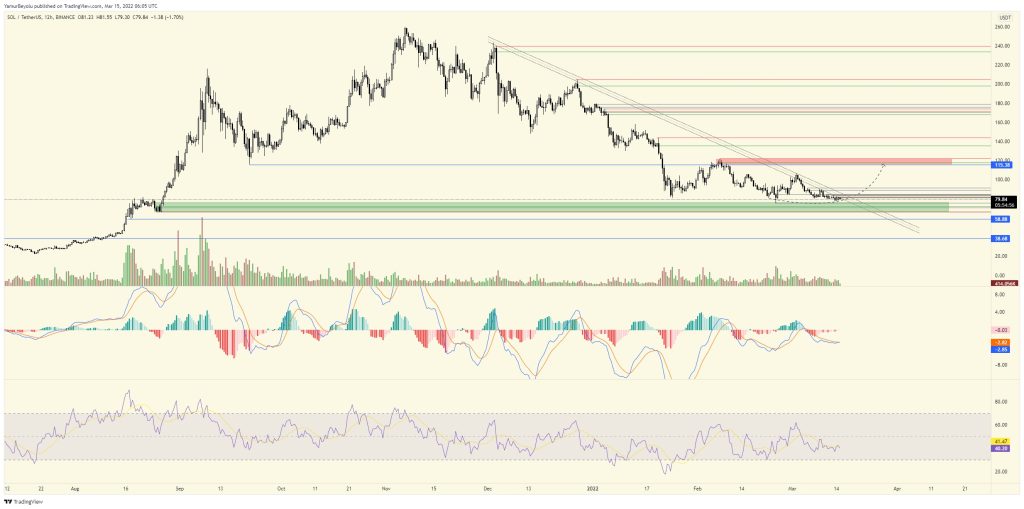
If we look at the price analysis of Solana, which has an important value in terms of volume, we can see that the signal line of the averages in the MACD indicator is very close to each other and there is an upward trend towards the upward trend, while at the same time, the selling pressure has decreased a little by reducing the effect of the histogram color.
On the price basis, Solana (SOL), which pulled back after failing to break the $98 and $107 zone, is trying to hold on to the major support zone in the $74 and $80 region.
With the purchases that will come through this support zone, the 98 and 100 dollar band gap can be followed first, and then the 115 and 120 dollars region, which is the trend and resistance area, by gaining upward momentum again.
It will be important for it to break this falling trend so that it can start an uptrend. On the other hand, if it closes daily below the band range of $74 and $80, which is the major support level, we may see a pullback to a lower support zone.
The RSI indicator has a value of 40.26. This shows that there is still shooting pressure and prices are at a bearish level.
As a result; For Solana, we can see positive reflections on the price if the selling pressure is lifted and it holds at the major support level, stopping the downtrend and creating a new upward wave with the dominance of buyers.