
Decreasing to $ 18,700 during the day bitcoincontinues to infuriate its investors. BTC, which is trading at 73 percent lower than its peak, continues to continue its bear season heavily.
The most important levels on the technical analysis side are the weekly MA200 ($22,485), and the monthly MA50 ($21,097) levels.
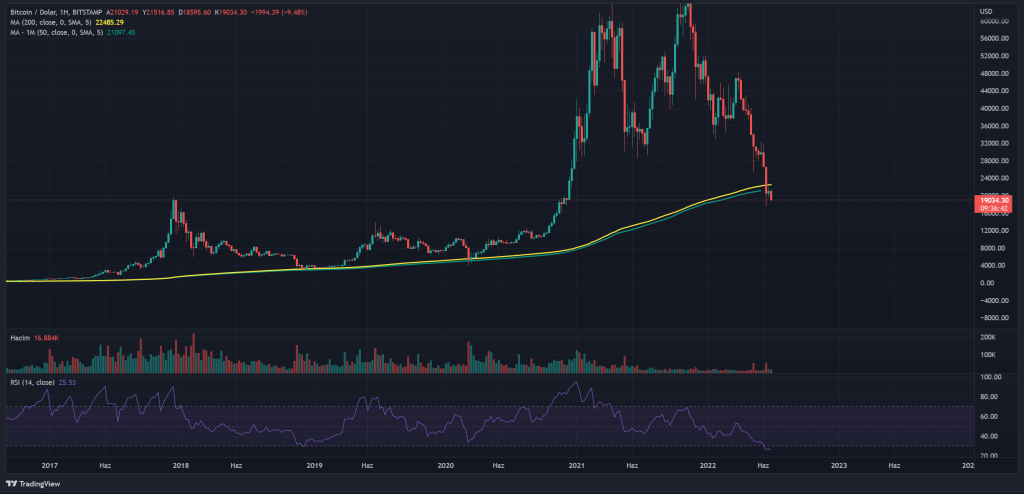
- The weekly MA200 level was traded as the support level in the previous bear seasons and appeared as the low levels of the bear season.
- The monthly MA50 level, on the other hand, was a level that has never been closed below in the history of Bitcoin. However, at the close of June, Bitcoin broke a new ground by closing monthly below this level.
In terms of technical analysis, daily and weekly closings above these levels will provide some relief to the price.
Again, it is difficult to say that a bullish trend has started in BTC without breaking the resistance area (blue line), which is in the range of $25,000 – $26,000 on the daily chart.
On the other hand, it is seen that the weekly RSI has fallen to 25 levels and reached the bottom levels.
Technically speaking, the next important support levels are $17,800 and $16,300.
What Does the On-Chain Data Show?
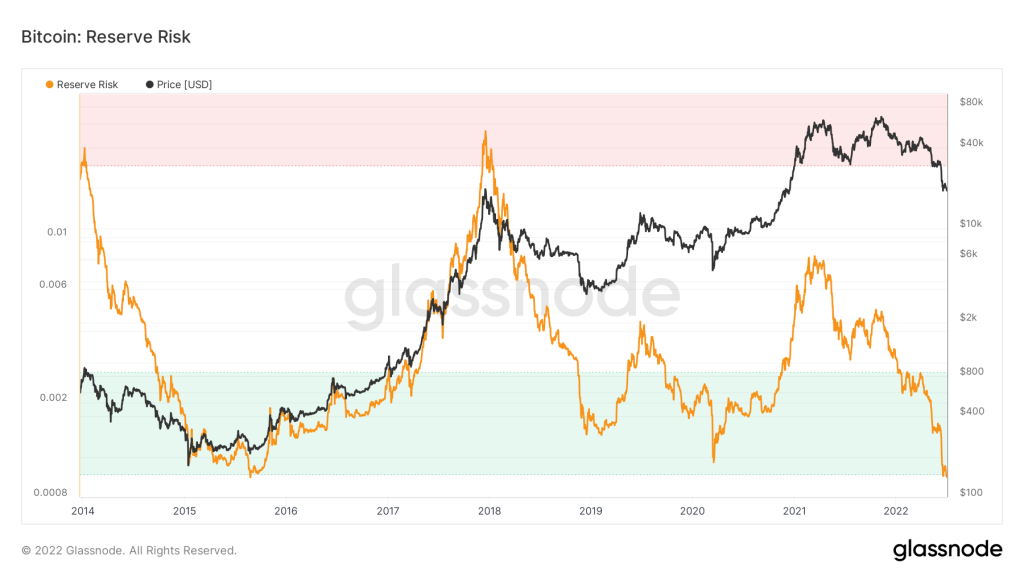
Bitcoin reserve risk, which allows us to see the risk/reward ratio of long-term investors in Bitcoin and has historically helped us find bottoms, has regressed to levels last seen in late 2014.
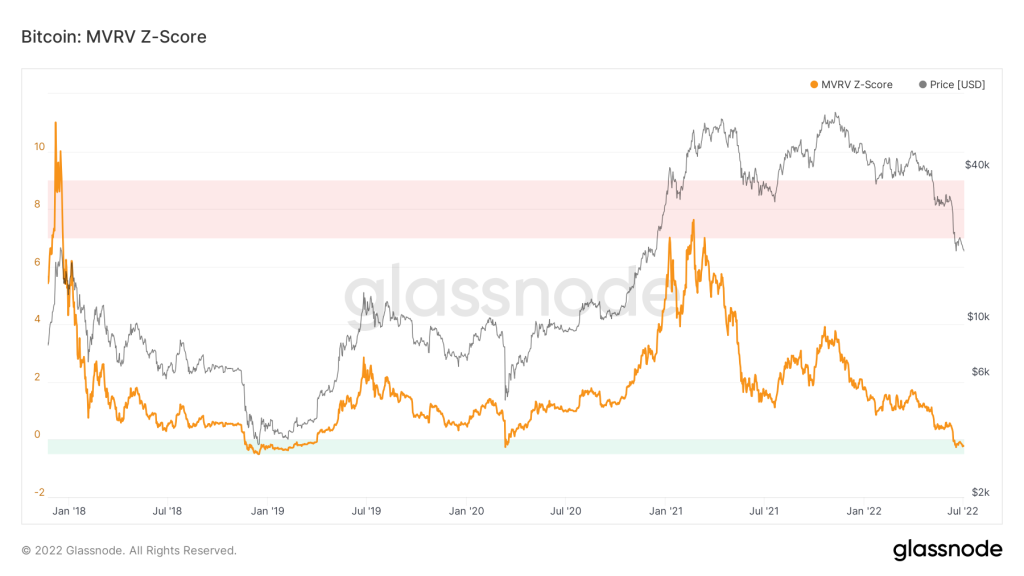
The MVRV indicator, which also gives very accurate results in finding the bottom levels, continues to move in the green area, which is considered as “bottom levels”, for 20 days.
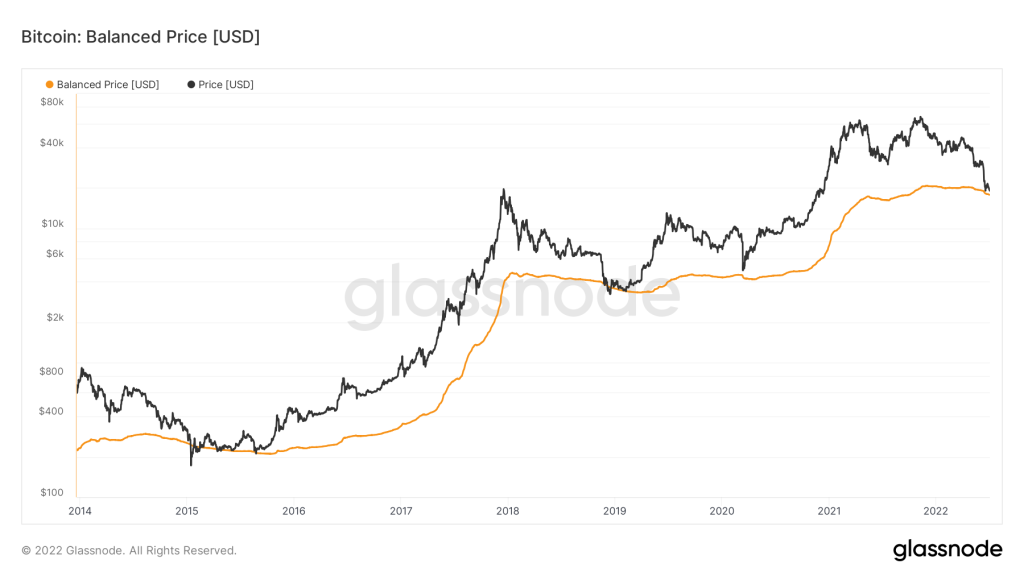
It is seen that the “Balance Price” indicator, which also serves as a support in the previous bear seasons and is calculated according to the total supply and total time, is very close. The current price of this indicator is seen as $ 17,750.
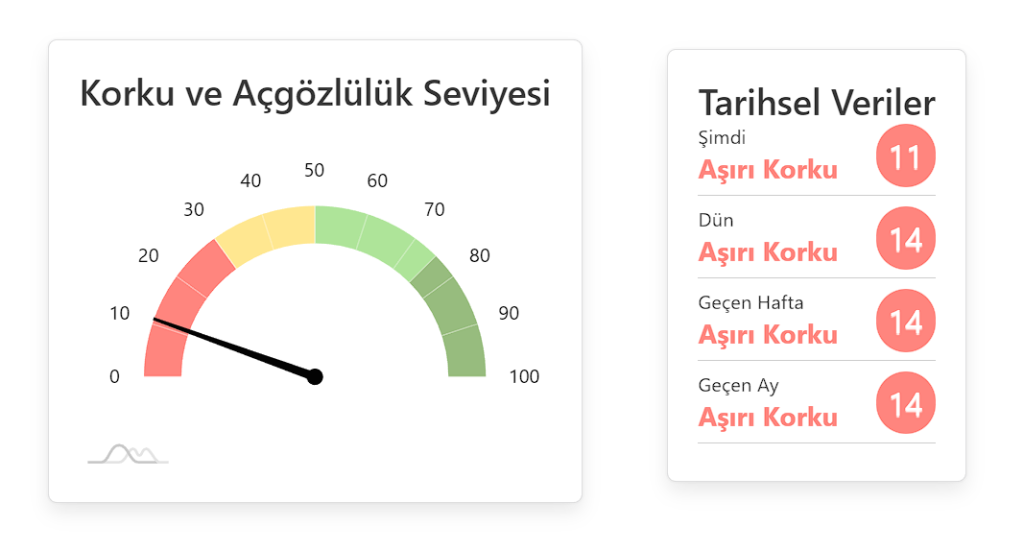
Looking at the fear and greed index, we remain in the “extreme fear” region for a long time with 11 points.
Although it is possible to say “about the bottom levels in BTC” in the light of all the data, it is impossible to predict exactly where the bottom is in this market.
While it seems logical for investors who are considering investments in the medium and long term to buy “partly” at these levels, it would be healthier to take a position according to macroeconomic events for the short term. It is very important to follow such data for the short term, especially in BTC, which has a high correlation with US stocks.
*Not investment advice.