
Cryptocurrency markets showed a recovery since the beginning of the week due to some global developments. bitcoinhas once again surpassed the psychological resistance of $20,000. recovery in the market, Ethereum (ETH) also affected the price. What does the new data of platforms tracking on-chain activities in the ETH network show for ETH?
Ethereum Merge update, which was a revolutionary for the history of crypto money, took place about 1 month ago. Investors who bought the prospect started selling as the news turned into reality. Forcing the $2,000 level 3-4 days before the Merge update, ETH dropped to $1,250 towards October.
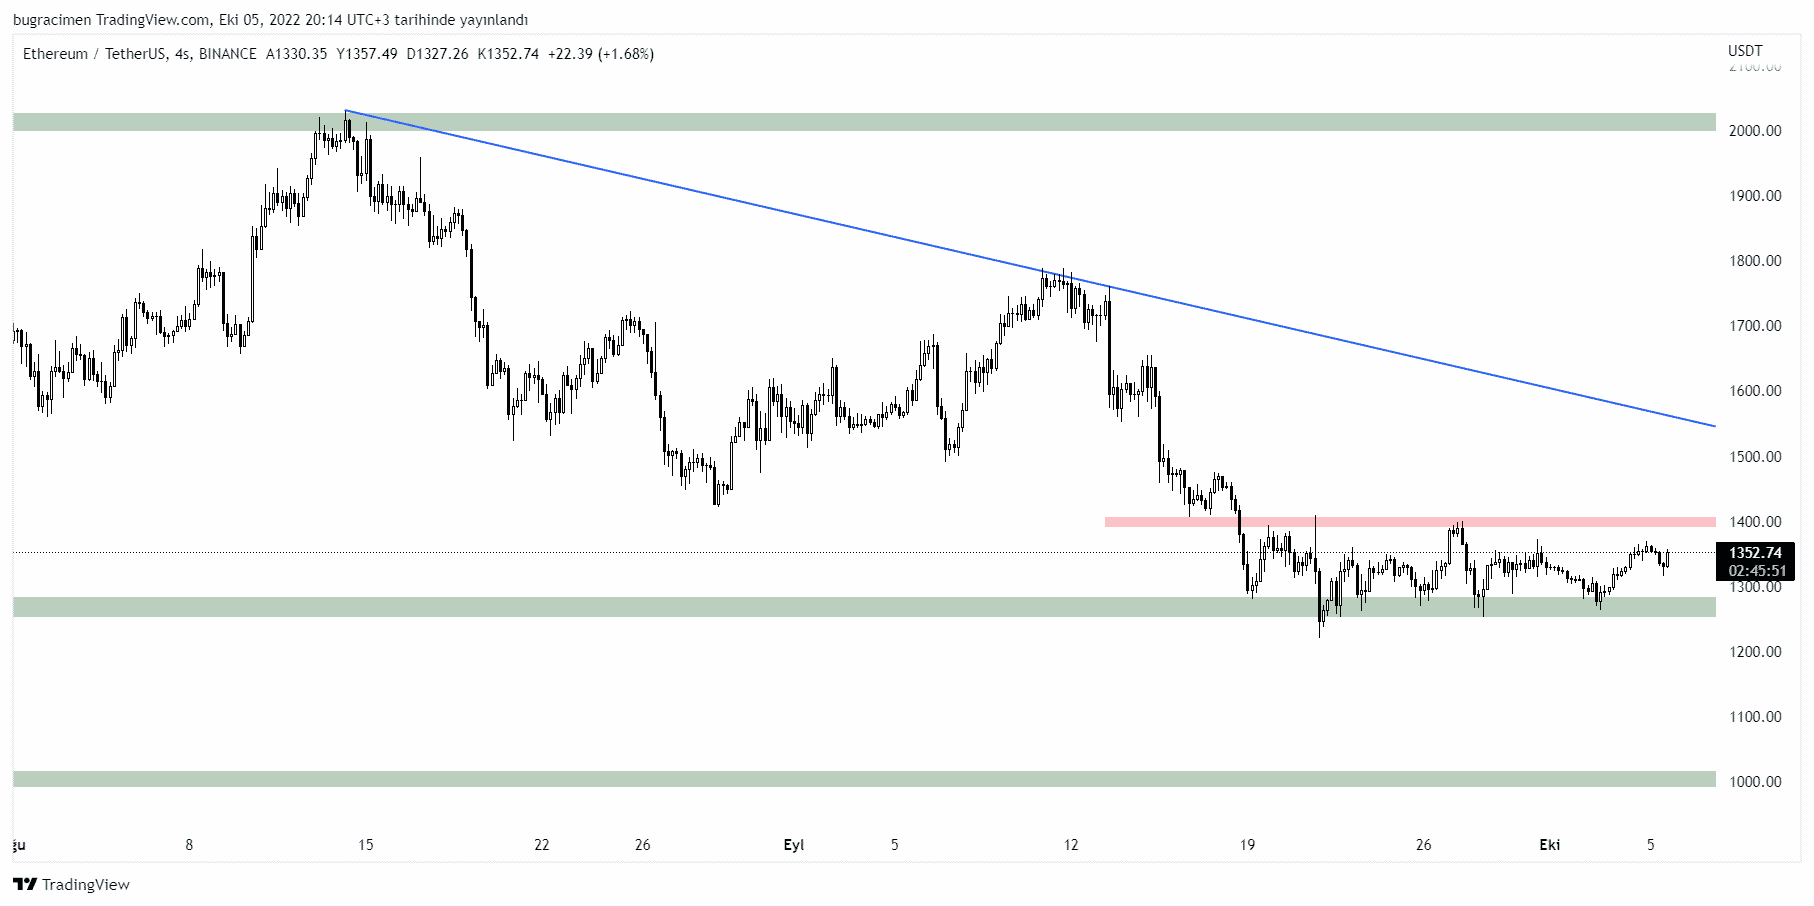
After the declines, ETH formed a support area in the range of $1,250-1,280 and has been flat in the $1,250-1,400 range for the past 1 month.
For Ethereum to continue bullish, traders should watch for 4-hour closes above the $1,400 level. In a bad scenario, if the $1,250 support is broken, Ethereum could drop as low as $1,000.
On-Chain Data Shows Recession!
The new data shared by the on-chain tracking site Glassnode reveals the stagnation in the Ethereum market.

According to the data, the number of wallets holding more than 100 Ethereum fell to the lowest level in the month. Crypto whales seem to be showing less interest in Ethereum after Merge.

Another data from Glassnode is about the volume of Ethereum. The average transaction volume on the ETH network dropped to 3,000 ETH. This clearly shows the stagnation in the cryptocurrency and ETH market in particular.
For exclusive news, analytics and on-chain data Telegram our group, twitter our account and YouTube Follow our channel now! Moreover Android and iOS Start live price tracking right now by downloading our apps!