
dogecoin Experts interpreting technical analysis show a significant upward trend in on-chain data.
The summary of technical indicators on the IntoTheBlock page is close to a ‘bullish’ outlook, showing four data in the neutral zone and two in the bullish direction. This improvement in sentiment is interpreted as an accurate reflection of the underlying strength and market dynamics of the meme coin. Here are the prominent technical indicators and Dogecoin reviewu.
Net network growth: It is in the neutral zone with a slight increase of 0.14. This metric reflects that the number of new addresses joining the network is stable. This stability is very important to maintain network health and potential growth.
In the money: Another neutral signal was the “in the money” indicator at 0.49%. This metric shows that a significant portion of addresses are at or near profitability, which can impact holding patterns among investors.
Concentration: The minimum concentration change of 0.03% is another important metric reflecting the decentralized spread of Dogecoin assets. It is noteworthy that with the help of the metric, the risk of price manipulation by large owners is reduced.
Major transactions: The slight decline of 3.91% in large transactions may indicate less institutional or whale activity, consistent with more stable, organic market movements.
Buying-selling volume imbalance: The 0.57% rise indicates a slight dominance of buy orders over sell orders. If this trend continues, the price increase expectation will increase.
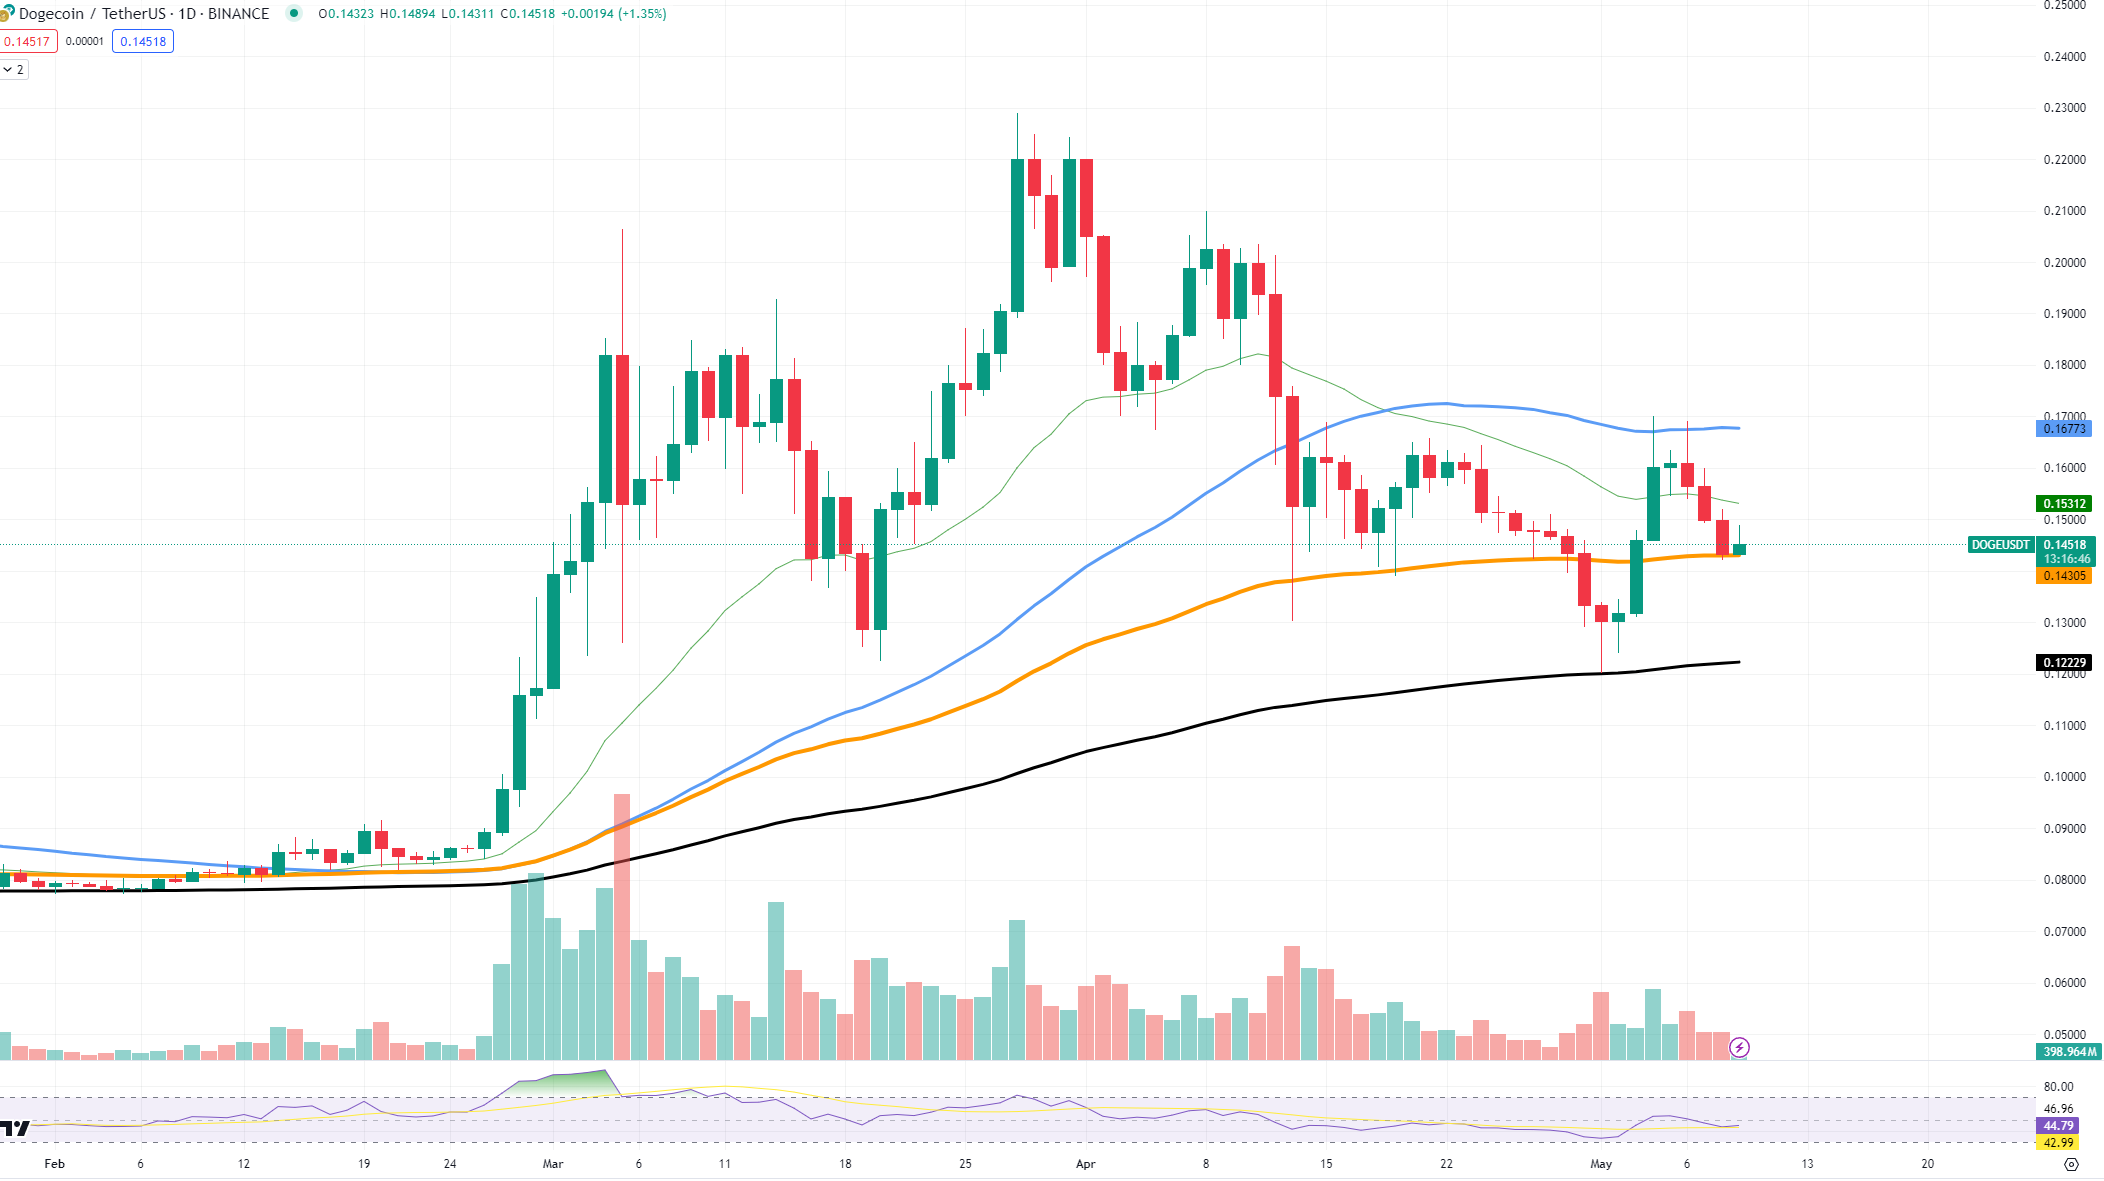
The trading chart for Dogecoin confirms these indicators.
Currently, DOGE is trading at $0.1444, while there is resistance near $0.1600. The price movement in this range, as well as the slight increase in trading volume, indicates continued interest and the potential for upward movement.
