
When we look at the general dynamics of the market recently, other altcoins along with Bitcoin went to a correction after a short-term upward momentum.
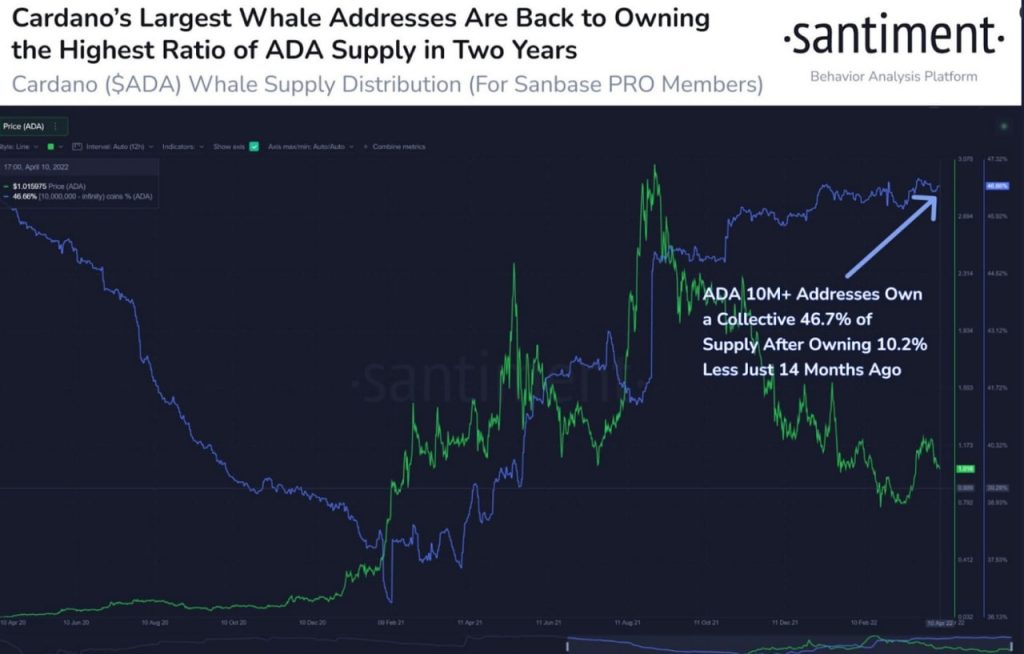
On the Cardano side, despite this decrease in price, when we look at the centiment data, we see that the share of whales holding more than 10 million ADA in the total supply has reached its highest level in 14 months.
In addition, we can see from the data that whales have 46.6% of the total supply and continue to receive ADA.
When we look at the daily chart of Cardano (ADA) from a technical point of view, apart from the on-chain data, it reached the level of $ 1.25 with the impulsive movement it made from the level of $ 0.78, which corresponds to March 14, and received a reaction from this region 2 times, and a pullback to the support of $ 0.90 occurred.
At the same time, the price is currently trading below the $1.03 region after breaking the downside market.
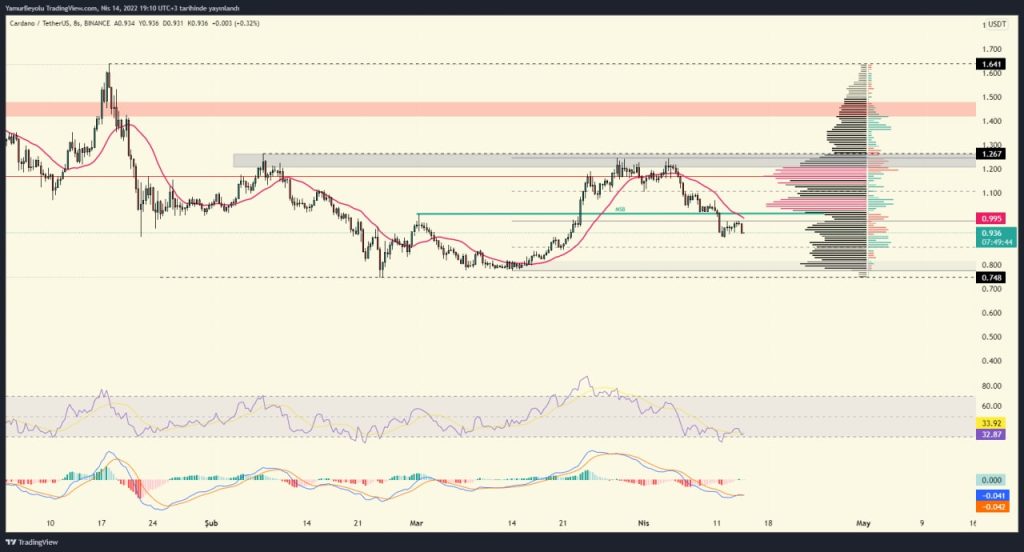
On the other hand, with the upward signal given by both the RSI and MACD indicators from the oversold regions, this msb area reacted and provided an increase of approximately 7%.
The price does not rise above the 21 EMA, and with the selling pressure it continues under the $0.975 zone, it can be pulled back to the $0.85 support mentioned at the bottom and then to the $0.80 and $0.78 regions.
In conclusion, we have to say that the continuation of the uptrend and downtrend on the Cardano side, like other coins, depends on the direction of Bitcoin in the current market conditions.
A new drop in Bitcoin will affect Cardano like other altcoins.