
Kava is for users to borrow stablecoin USDX and start earning returns.
Cross-chain DeFi lending enabling investment in various cryptocurrencies
known as the platform.

When we look at the coinmarketcall side, there are many news with the alpha version of the layer-1 block chain merger, the ETH bridge beta launch and many other launches.

How can we interpret the signals on the 3-day chart in line with the technical data and parallel to the general market?
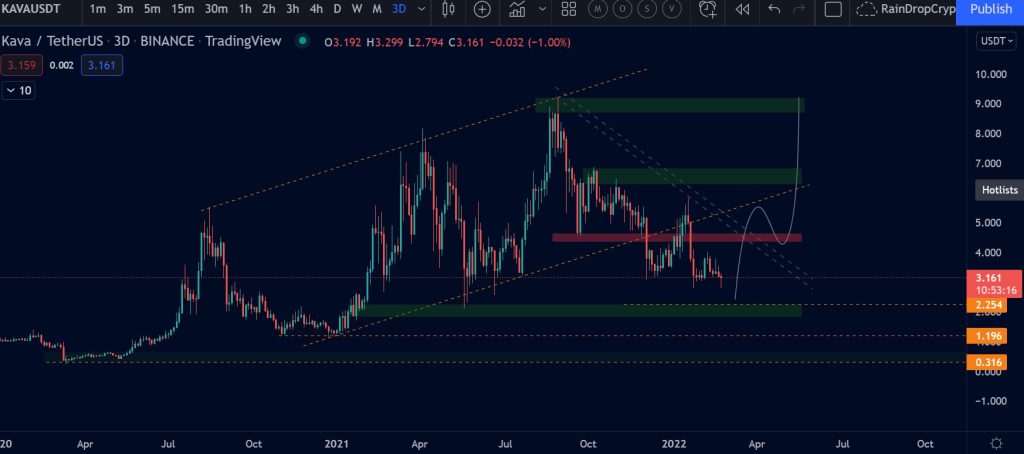
The overall market is currently showing a falling trend structure on the side of both BTC and ETH leading altcoins.
However, we can observe that some of the news-intensive altcoins are positively differentiated from this situation. KAVA, which has a price movement at the current level of $ 3.13, has continued to rise with rising lows since December 20, 2020 and broke the trend and disrupted its rising structure on December 3, 2021.
On the other hand, it is a fib drawn since the starting price. The $2.25 and $1.8 range, which coincides with the correction level, forms the important support area, namely the demand zone.
In the good scenario, with strong buyers and volume from this region, the upper resistance levels can be followed if it breaks the falling trend since August 29, 2021 and the resistance level in the $ 4.6 region and pulls back, that is, if it is permanent with a pullback.
In another scenario, we can observe a pullback to the lower support levels of 1.83 and 1.97 dollars, which is indicated by the deterioration of the demand structure.
With the technical analysis data specified, it may be possible to see positive movements in the price in the coming days, according to the coming and developing news flows.