
The price of the leading altcoin Ethereum started to increase yesterday. Today it has almost surpassed its 2023 high. In contrast, the price of Bitcoin (BTC) has decreased since yesterday. It even visited below $45,000 today. This brought to mind the question of whether the ‘altcoin season’ is starting. Crypto analyst Valdrin Tahiri is looking for an answer to this question in the light of the latest data.
Ethereum soars amid Bitcoin ETF news!
cryptokoin.comAs you follow from, the SEC tweeted that the Bitcoin ETF was approved. However, shortly after, SEC chairman Gary Gensler announced that the social media account was hacked and that no decision had been made about the Bitcoin ETF yet. Price action for BTC and ETH (green) has diverged since the announcement. While ETH price increased by 5%, BTC decreased by 4%.
On-chain data shows that in the last 24 hours, a whale borrowed $11 million worth of BTC from the AAVE lending protocol and exchanged it for $11 million worth of ETH. On-chain data also shows an unprecedented increase in the holdings of ETH whales. Smart Money flows also show that more than $23 million has flowed into ETH in the last 24 hours.
What do other analysts say?
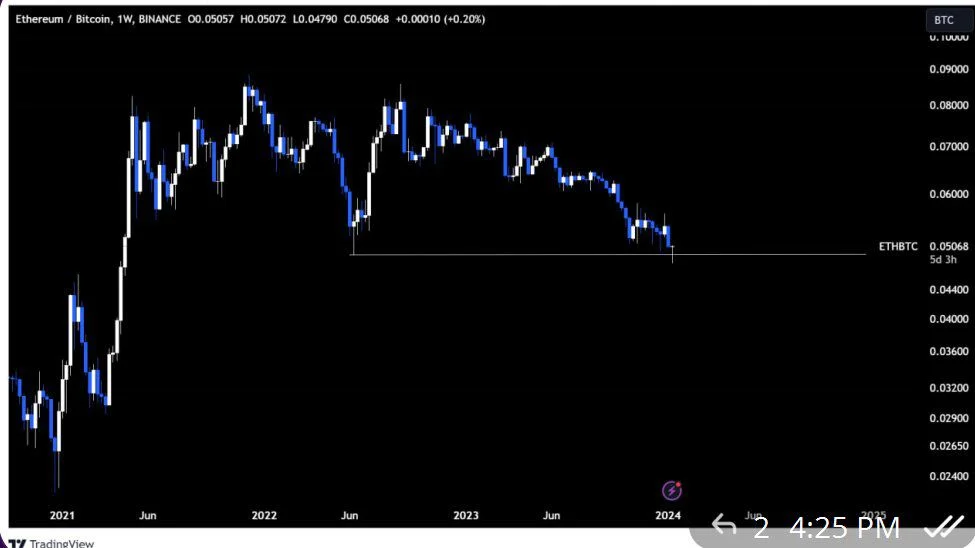
Cryptocurrency traders and analysts say the narrative is changing. In this regard, they state that a fund flow has begun from Bitcoin to Ethereum. Alex Kruger predicts that the ETH/BTC bottom is likely inside. Will Clemente shares ETH/BTC chart showing a divergence below 2022 lows.
Finally, Cool Shiller suggests that the narrative will switch to an ETH ETF, causing the price to pump.
Bitcoin dominance rate (BTCD) prediction: Will the altcoin season begin?
The 3-day chart for BTCD shows that the price has been rising within an ascending parallel channel since November 2022. Such channels often contain corrective actions. So it is possible that there will be a breakout from this channel. BTCD is trading at the bottom of this channel. This is further consistent with the possibility of a breakout following. Additionally, the 3-day Relative Strength Index (RSI) is giving bearish signals.
RSI is a momentum indicator that investors use to evaluate whether a market is overbought or oversold and whether an asset should be accumulated or sold. Readings above 50 and an upward trend indicate that the bulls still have the advantage, while readings below 50 indicate the opposite. The 3-day RSI has fallen since forming a bearish divergence (green) coinciding with the BTCD top. If BTCD breaks out of the channel, a 10% drop to the nearest support at 48.50% is possible. This is likely to be the catalyst for a minor altcoin season.

Despite this bearish BTCD price prediction, a retracement of the channel’s middle line could trigger an 11% upside move to the channel’s resistance trend line of 60%.
To be informed about the latest developments, follow us twitter‘in, Facebookin and InstagramFollow on and Telegram And YouTube Join our channel!