
The Turkish Statistical Institute (TÜİK) published its report comparing the population distribution of Turkey with the world and European Union countries. The report also became a clear indicator of our position between developed and underdeveloped countries.
As World Population Day, which was determined as 11 July by the United Nations Development Program, is approaching, today From the Turkish Statistical Institute important data has arrived. In its new report, TURKSTAT included the current population information and distribution in our country and the comparison of our population with the rest of the world.
According to the data shared by TUIK, Turkey today 84 million 680 thousand 273 people population owner. With this population, our country ranks 18th among 195 countries in terms of population size and constitutes 1.1% of the world population of 7 billion 874 million people. So, how is Turkey in terms of population distribution compared to other countries?
Child population ratio is below the world average in Turkey:
- First graphic: Comparison of child population ratio with world countries
- Second graph: Comparison of child population ratio with European Union countries
Countries with the highest proportion of children:
- Niger (56.4%)
- Financial (53.8%)
- Chad (53.2%)
- Somalia (53%)
- Angola (52.9%)
- Uganda (52.7%)
- Democratic Republic of the Congo (52.3%)
- Burundi (51.5%)
- Burkina Faso (51%)
- Mozambique (50.8%)
Countries with the lowest child population ratio:
- Spain – 17.2%
- Malta – 17.1%
- Germany – 16.9%
- Greece – 16.5%
- Qatar – 16%
- Portugal – 15.9%
- Italy – 15.7%
- Republic of Korea – 15%
- Japan – 15%
- Singapore – 14.9%
While the rate of child population in Turkey is announced as 26.9%, it is seen that this rate is both below the world average. While the situation is the same in developed countries, it is seen that Turkey is the leader in child population ratio compared to European Union countries. The country with the highest child population rate is measured as Niger. The 10 countries with the highest child population are listed as follows:
Where are we in the young population?
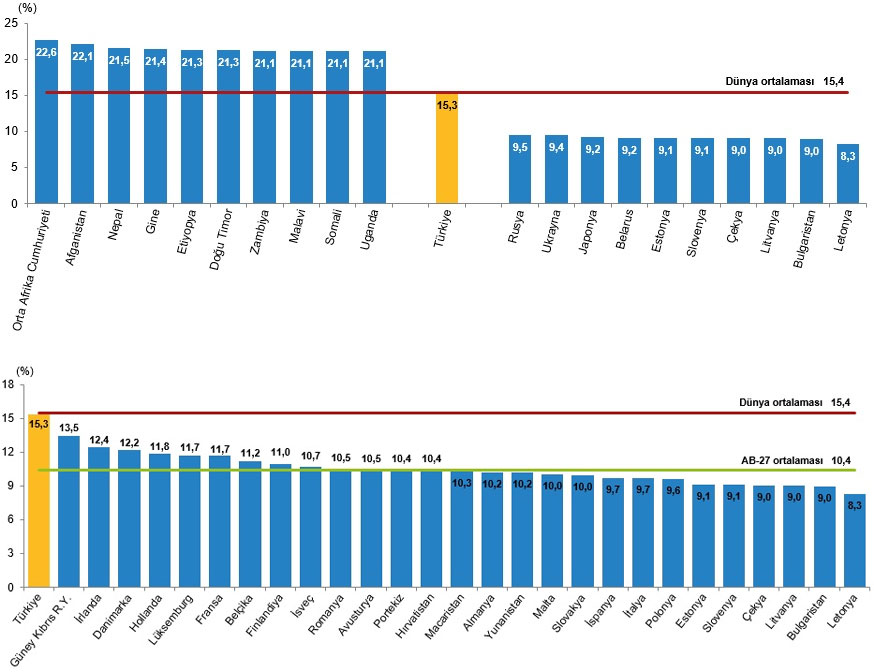
- First graphic: Comparison of young population ratio with world countries
- Second graph: Comparison of young population ratio with European Union countries
Countries with the highest proportion of young people:
- Central African Republic – 22.6%
- Afghanistan – 22.1%
- Nepal – 21.5%
- Kyrenia – 21.4%
- Ethiopia – 21.3%
- East Timor – 21.3%
- Zambia – 21.1%
- Malawi – 21.1%
- Somalia – 21.1%
- Uganda – 21.1%
Countries with the lowest youth population:
- Russia – 9.5%
- Ukraine – 9.4%
- Japan – 9.2%
- Belarus – 9.2%
- Estonia – 9.1%
- Slovenia – 91%
- Czech Republic – 9%
- Lithuania – 9%
- Bulgaria – 9%
- Latvia – 8.3%
The rate of young population in Turkey is measured as 15.3%.
Where are we in the proportion of the elderly population?
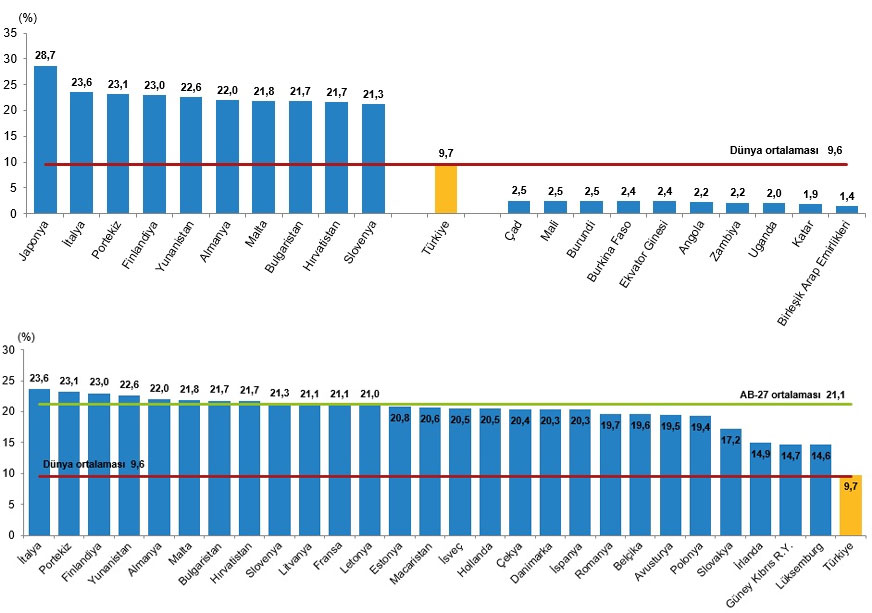
- First graphic: Comparison of elderly population ratio with world countries
- Second graph: Comparison of elderly population ratio with European Union countries
Countries with the highest proportion of elderly population:
- Japan – 28.7%
- Italy – 23.6%
- Portugal – 23.1%
- Finland – 23%
- Greece – 22.6%
- Germany – 22%
- Malta – 21.8%
- Bulgaria – 21.7%
- Croatia – 21.7%
- Slovenia – 21.3%
Countries with the lowest proportion of elderly population:
- Chad – 2.5%
- Financial – 2.5%
- Burundi – 2.5%
- Burkina Faso – 2.4%
- Equatorial Guinea – 2.4%
- Angola – 2.2%
- Zambia – 2.2%
- Uganda – 2%
- Qatar – 1.9%
- United Arab Emirates – 1.4%
The elderly population rate in Turkey is measured as 9.7%.
Well, what is the average life expectancy at birth for men in Turkey and in the world?
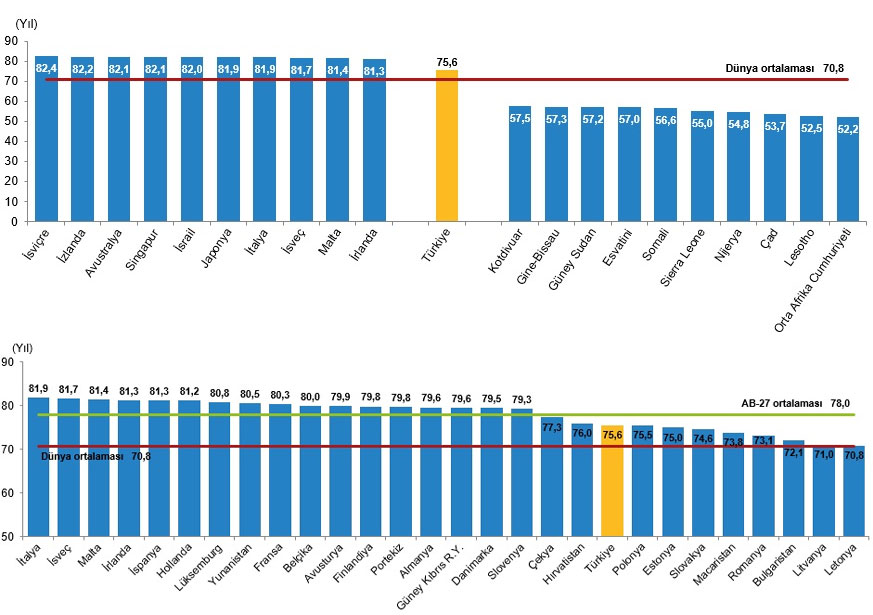
- First chart: Comparison of life expectancy at birth for men with world countries
- Second graph: Comparison of life expectancy at birth for men with European Union countries
Countries with the highest life expectancy at birth for men:
- Switzerland – 82.4
- Iceland – 82.2
- Australia – 82.1
- Singapore – 82.1
- Israel – 82
- Japan – 81.9
- Italy – 81.9
- Sweden – 81.7
- Malta – 81.4
- Ireland – 81.3
Countries with the lowest life expectancy at birth for men:
- Kotdivuar – 57,5
- Guinea-Bissau – 57.3
- South Sudan – 57.2
- Esvatini – 57
- Somalia – 56.6
- Sierra Leone – 55
- Nigeria – 54.8
- Chad – 53.7
- Lesetho – 52.5
- Central African Republic – 52.2
Life expectancy at birth for men in Turkey is measured as 75.6.
What is the average life expectancy at birth for women?
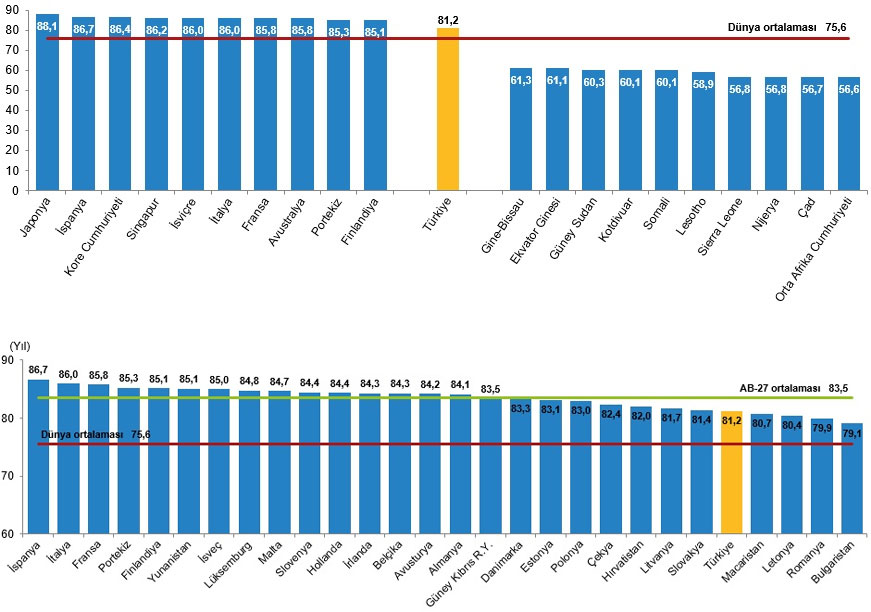
- First chart: Comparison of life expectancy at birth for women with world countries
- Second graph: Comparison of life expectancy at birth for women with European Union countries
Countries with the highest life expectancy at birth for women:
- Japan – 88.1
- Spain – 86.7
- Republic of Korea – 86.4
- Singapore – 86.2
- Switzerland – 86
- Italy – 86
- France – 85.8
- Australia – 85.8
- Portugal – 85.3
- Finland – 85.1
Countries with the lowest life expectancy at birth for women:
- Guinea-Bissau – 61.3
- Equatorial Guinea – 61.1
- South Sudan – 60.3
- Kotdivuara – 60.1
- Somalia – 60.1
- Lesetho – 58.9
- Sierra Leone – 56.8
- Nigeria – 56.8
- Chad – 56.7
- Central African Republic – 56.6
Life expectancy at birth for women in Turkey is measured as 81.2.
Source :
https://data.tuik.gov.tr/Bulten/Index?p=Dunya-Nufus-Gunu-2022-45552&dil=1