
With the decline of the dollar, the gold price is hovering around the $2,000 level. Under current conditions, economic data increases the attractiveness of gold. According to analysts, interest rate cut expectations support the bullish outlook for gold.
As the dollar weakens, the appeal of gold increases
The gold price approached the $2,000 level, driven by the weakening US dollar and falling Treasury yields. At the time of writing, spot gold was trading at $1,995.10, up slightly by 0.22%. In fact, the shiny metal hit a three-week high at the beginning of the week.
Meanwhile, the 0.2% decline in the US dollar against major currencies and lower transaction volumes due to the US bank holiday made gold more affordable for international buyers. This weakness in the dollar, following market adjustments to recent economic data and Federal Reserve rate hike expectations, supports gold’s current strength.
Interest rate hike expectations and gold price
Following the decline in unemployment claims, the US dollar experienced a short-term rise. Additionally, other economic indicators painted a more complex picture. Orders for long-lasting US goods unexpectedly fell in October, signaling a cooling in the economy. In addition, the University of Michigan survey showed that consumers expect higher inflation in both the short and long term.
Market expectations that the Fed will cut interest rates in 2024 have decreased. This affected the yields of US Treasury bonds and therefore the price of gold. Low interest rates generally reduce the opportunity cost of holding non-yielding gold bullion. This makes gold more attractive to investors.
Short-term outlook for gold price: Uptrend prevails
Market analyst James Hyerczyk evaluates the short-term outlook for gold. The interaction between the US dollar’s trajectory, economic data, and Fed policies points to a potentially bullish short-term outlook for gold. As investors evaluate these factors, the appeal of the precious metal as a safe-haven asset may continue to grow in the face of economic uncertainty.
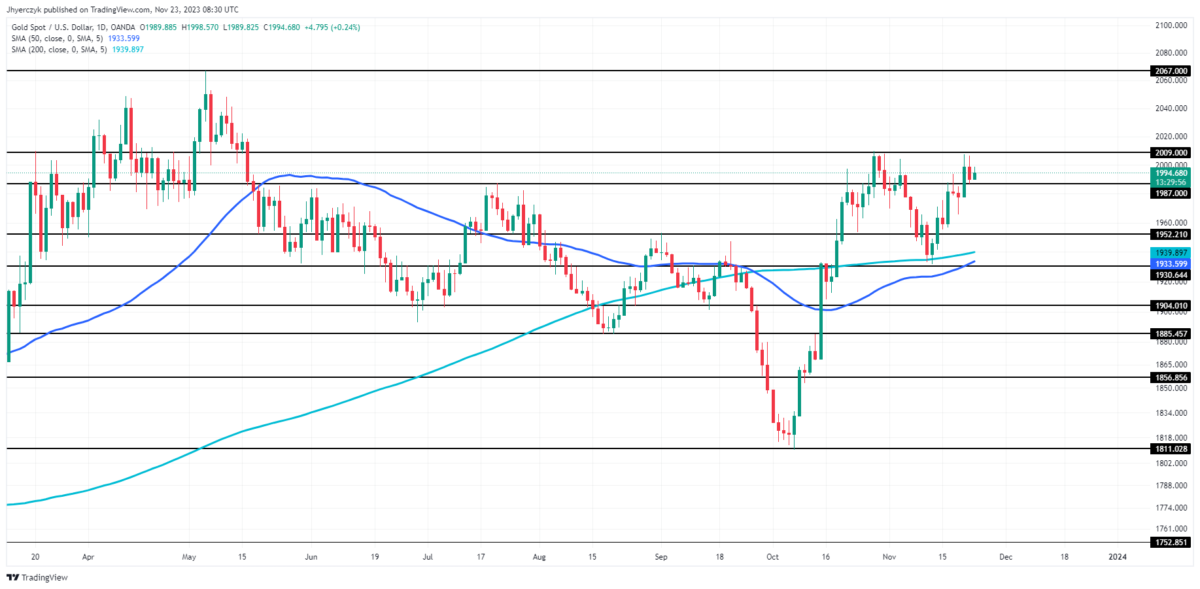
Gold is currently trading at $1,995.52. Therefore, it stands between the minor support level at $1,987.00 and the minor resistance at $2,009.00. This places the price above the 200-day and 50-day moving averages set at $1,939.90 and $1,933.61 respectively. This indicates a strong upward trend in the long term. The proximity to minor resistance suggests a test point for further bullish momentum. If the gold price breaks this resistance, it is possible to target the main resistance at $2,067.00. Conversely, if it breaks below the minor support, it is likely to retest the major support at $1,952.21.
Gold price technical analysis: Bullish Cross confirmation indicates upside
Market analyst Dhwani Mehta interprets what he sees in the technical picture of gold as follows. Risks remain to the upside for the gold price following confirmation of the 50-day Simple Moving Average (SMA) and the 100-day SMA ‘Bullish Cross’. Additionally, the rise of the 14-day Relative Strength Index (RSI) indicator adds confidence to the upside potential. A daily close above the $2,000 threshold is critical for further gains. Additionally, the monthly high of $2,009 acts as initial resistance. The next upside target lies near the mid-May high at $2,020.

On the downside, the nearest support is at $1,977, the 21-day SMA. Below this, the $1,955 -$1,950 region will be on the radar of gold sellers. A sustained break below the latter could threaten the November 14 low at $1,944 and the subsequent ascending 200-day SMA at $1,939.
To be informed about the latest developments, follow us twitter‘in, Facebookin and InstagramFollow on and Telegram And YouTube Join our channel!