
these three altcoin, exhibiting positive trends towards Bitcoin (BTC). In this context, it is estimated that it can outperform Bitcoin in March.
Altcoins showing positive trends against BTC are listed below.
Solana (SOL) Price Bounced From Support
Weekly time frame analysis shows that SOL broke out of the long-term downtrend and has been rising rapidly since it was confirmed as support in September 2023. This rise progressed to ₿0.0029 in December 2023. After retreating slightly from this high, SOL bounced into a sideways area at ₿0.0020 this week.
Elliott Wave theory indicates that the fourth wave of the SOL has been completed. This theory analyzes long-term price patterns and investor psychology to determine trend direction. According to wave counting, SOL price is currently in the fourth wave and could rally another 100% towards the next resistance at ₿0.0040.
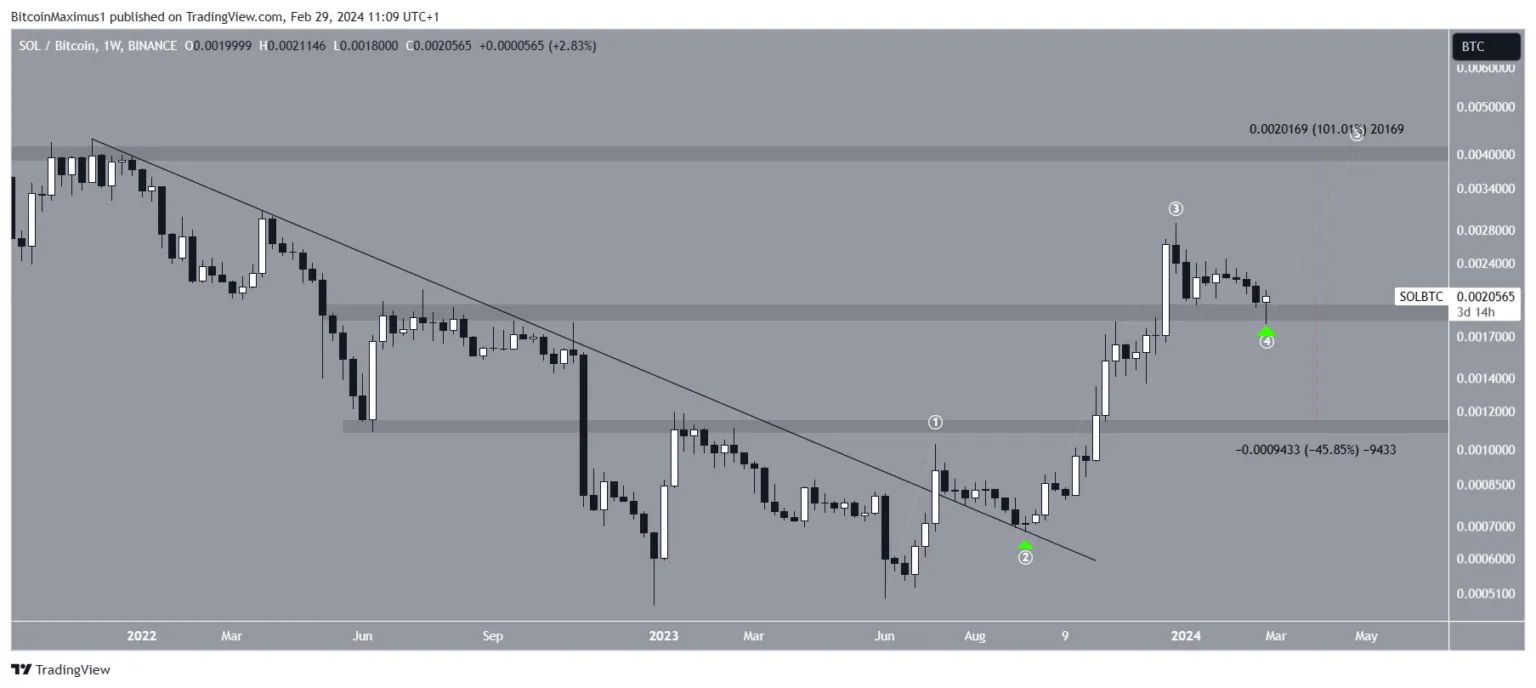
Despite the bullish SOL price forecast, a close below the ₿0.040 area will invalidate the count and could trigger a 45% decline to the nearest support at ₿0.0011.
Dogecoin (DOGE) Forms a Bullish Divergence
dogecoinThe price has shifted below a descending resistance trend line since October 2022. This decline fell to 157 satoshi this week. However, DOGE price rose and formed a major weekly bullish candlestick. If the weekly close occurs at these levels, DOGE will leave the descending resistance trend line after 490 days.
Before the bounce, a bullish divergence was observed in the RSI. Traders use the RSI as a momentum indicator to assess whether a market is overbought or oversold and to determine whether to accumulate or sell an asset.
When the RSI value is above 50 and the trend is upward, the bulls still have the advantage. But if the value is below 50, the opposite is true. When a price decline is accompanied by an increase in momentum, a bullish divergence occurs. This usually results in an uptrend reversal.
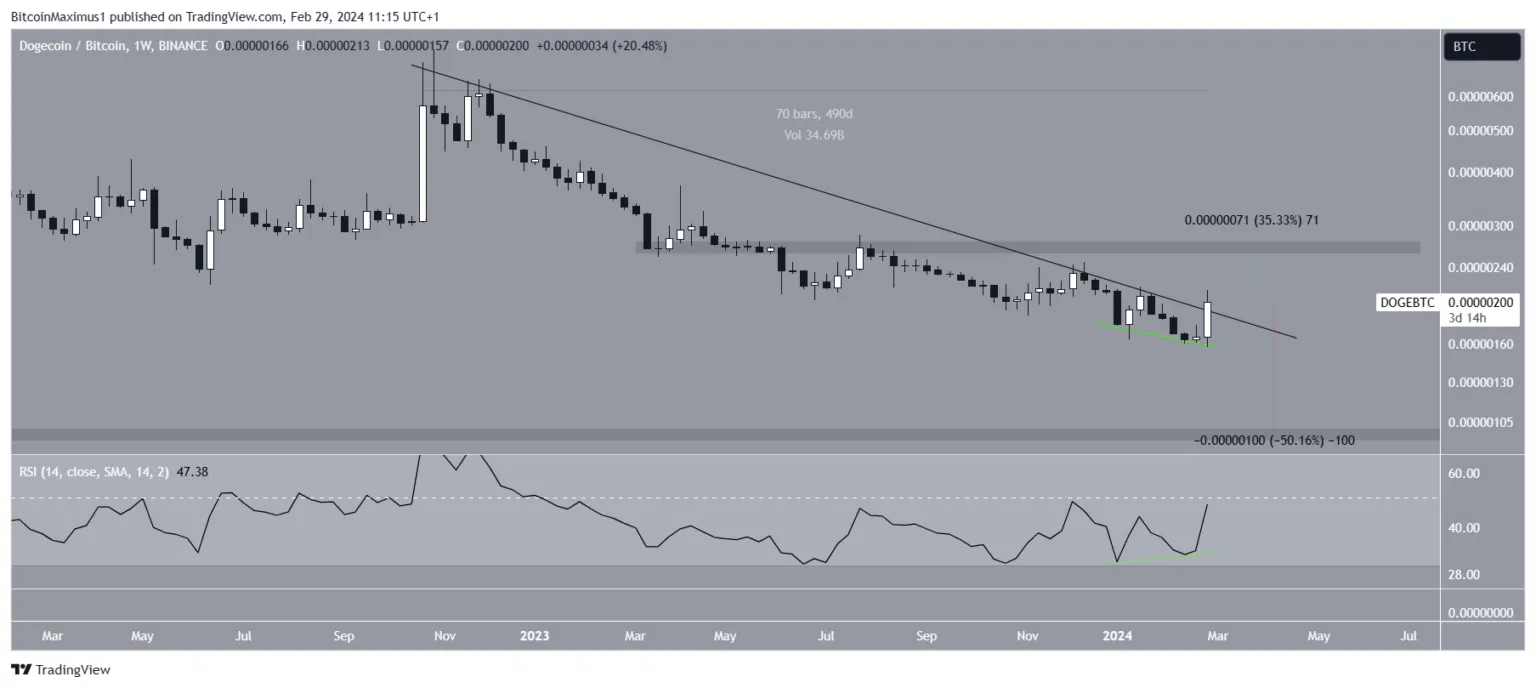
If DOGE confirms the breakout, it could see a 35% increase towards the next resistance at 270 sats. However, in case of failure, the pullback to the nearest support level of 100 satoshis could be up to 50%.
The Graph (GRT) Looks Like It’s About to Break
The last altcoin that could outperform BTC GRTis. GRT price broke below a descending resistance trend line that has existed since the all-time high. A bounce at the trend line (green symbol) initiated a breakout above GRT’s 450 satoshi resistance zone.
This breakout was confirmed by an RSI rise above 50. Therefore, if the upward move continues, The Graph could rise another 90% until the next resistance at 900 satoshis.
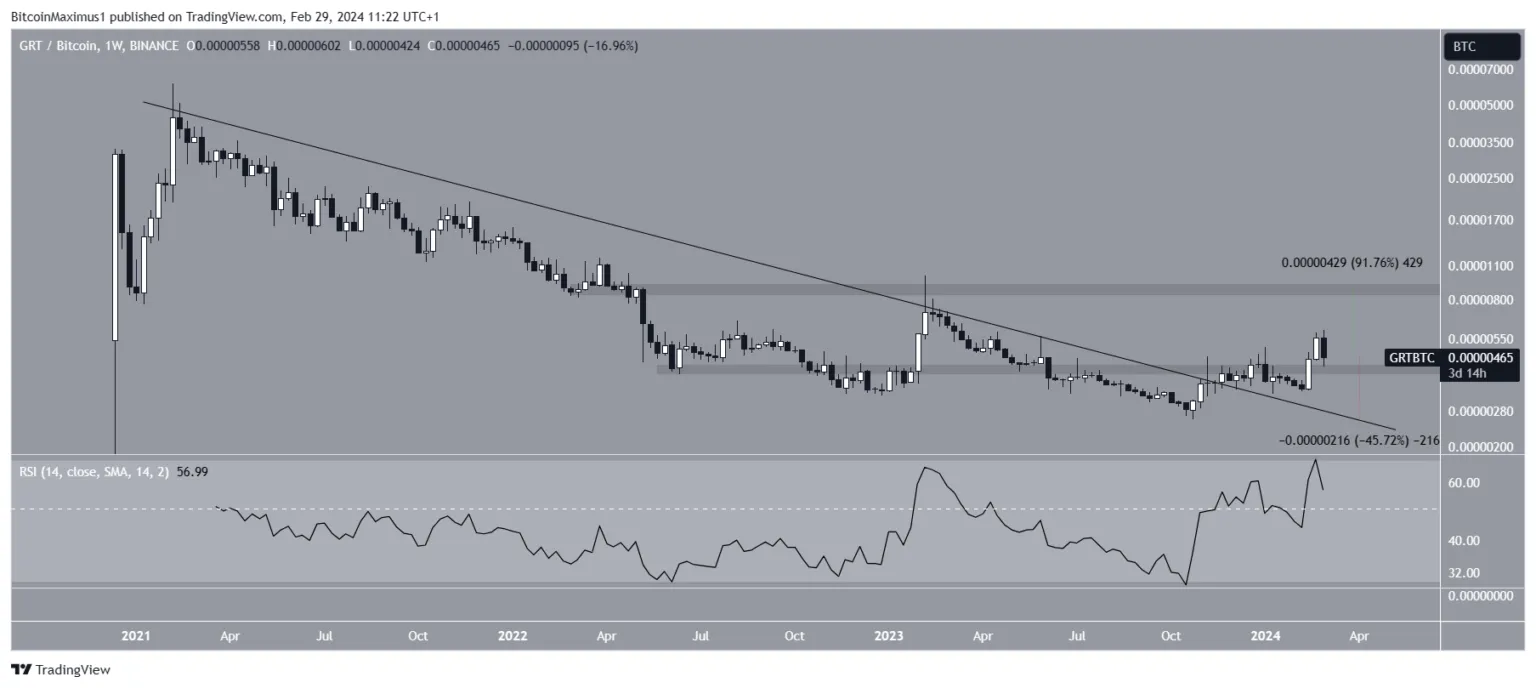
Despite the bullish GRT price forecast, a close below the 450 satoshi support area could lead to a 45% drop to the resistance trend line at 280 satoshis.
