Bitcoin’s short-medium-long-term support and resistances. Will Bitcoin rise again?
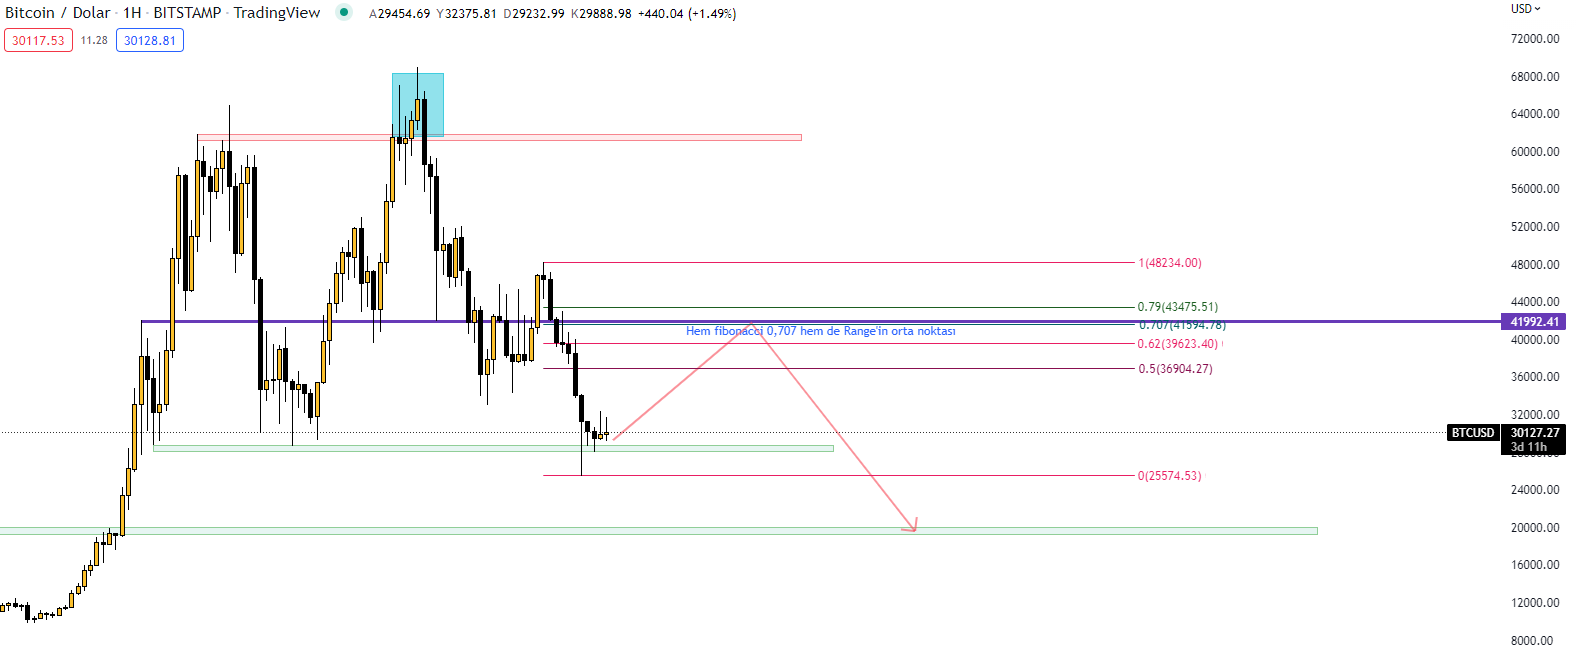 On the Bitcoin 1-week chart, we see that it can hold on to support for now. In the long run, if bitcoin stays above support, the first resistance area it will encounter is the area where the opening candle of April and the Fibonacci retracement 0.5 level are located. 36,600-37,000 region looks like. In case of passing these levels 48,000 dollars and 65,000 dollar levels are other resistances. In the event that the support is lost, a drop to $19,600, the previous high of Bitcoin, may occur. Not one up per week directional reversal candle did not occur is being considered.
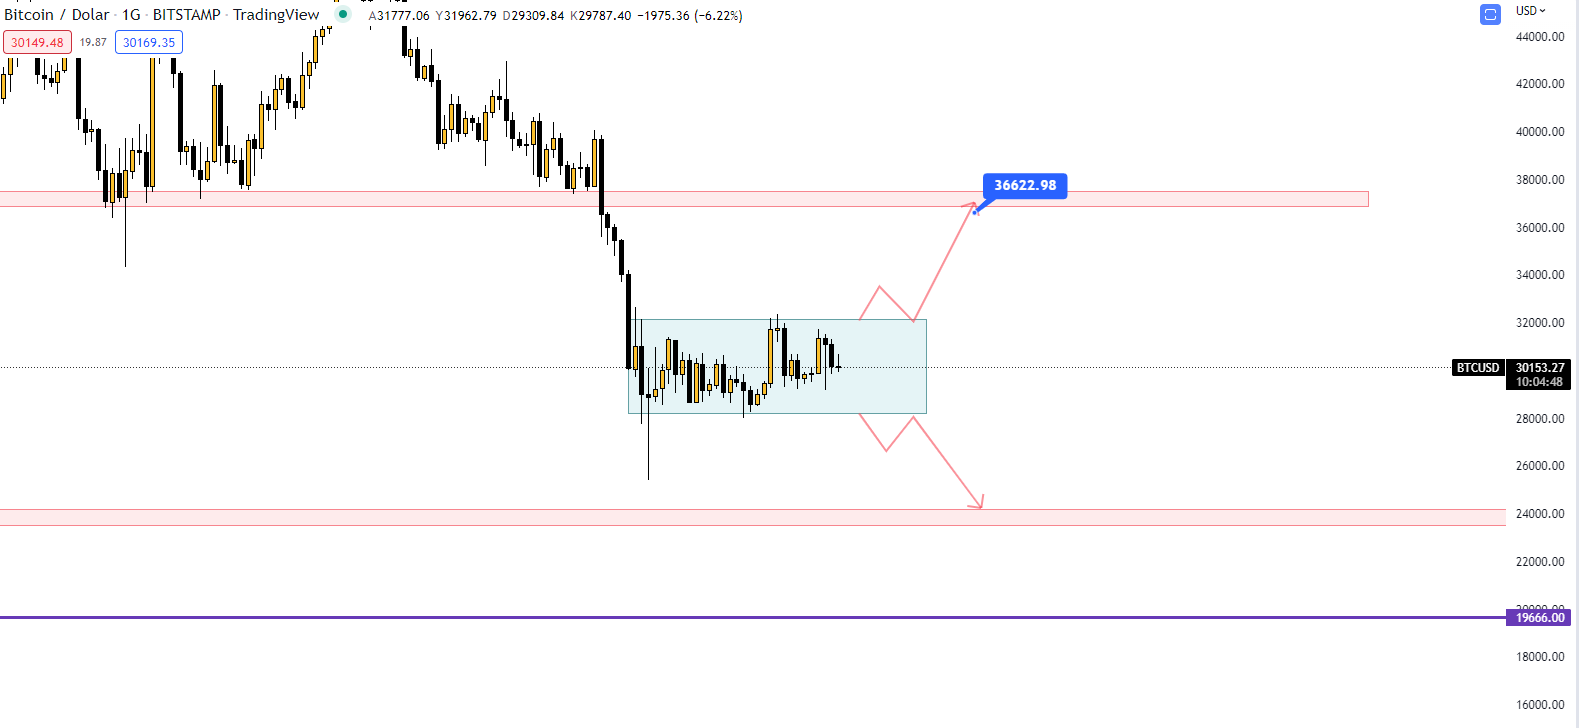
In Bitcoin’s daily chart, we are in a range that we do not know yet whether it is a concentration zone or a distribution zone. The direction of Bitcoin will be understood more clearly in case of a break between the 32.200 level and the 28.300 level. In case of an upside break, a rise towards 36.600 levels can be expected. It is thought that the upward movements of Bitcoin, which is in very hard movements while falling, will be like this. However, the gap (Gap) at 28.800 levels in the Chicago stock market Bitcoin futures has not been filled yet. Graphics generally tend to fill in the blanks.
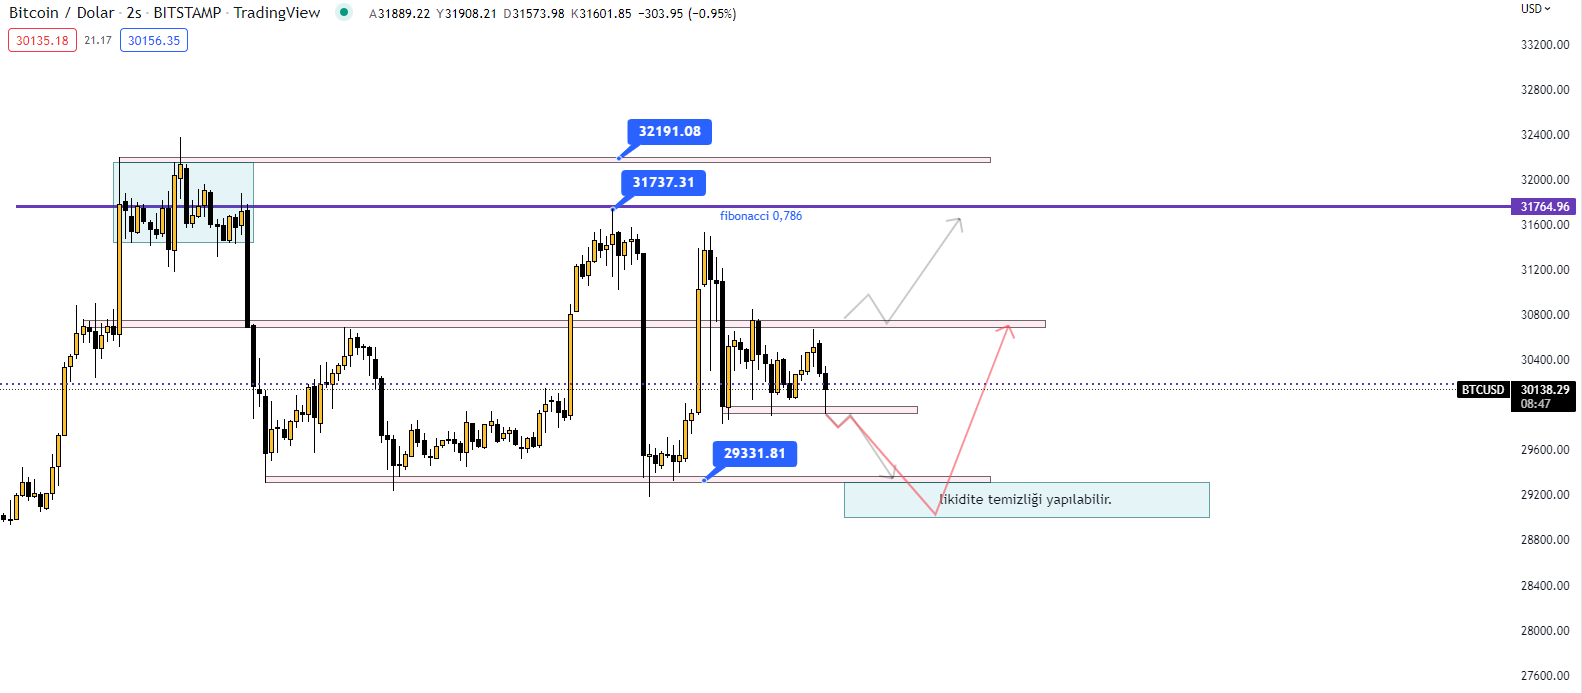
On the 2-hour chart of Bitcoin, there was a sharp decline after the distribution phase indicated by the blue box. Continuing its movements within a certain range, Bitcoin made a new low bottom after falling and the Fibonacci correction 0.786 It rose up to the levels and fell again without making a high peak. On the 2 hour chart 29300 while their levels act as a nice boost 32000 Dollar levels are working as resistance.
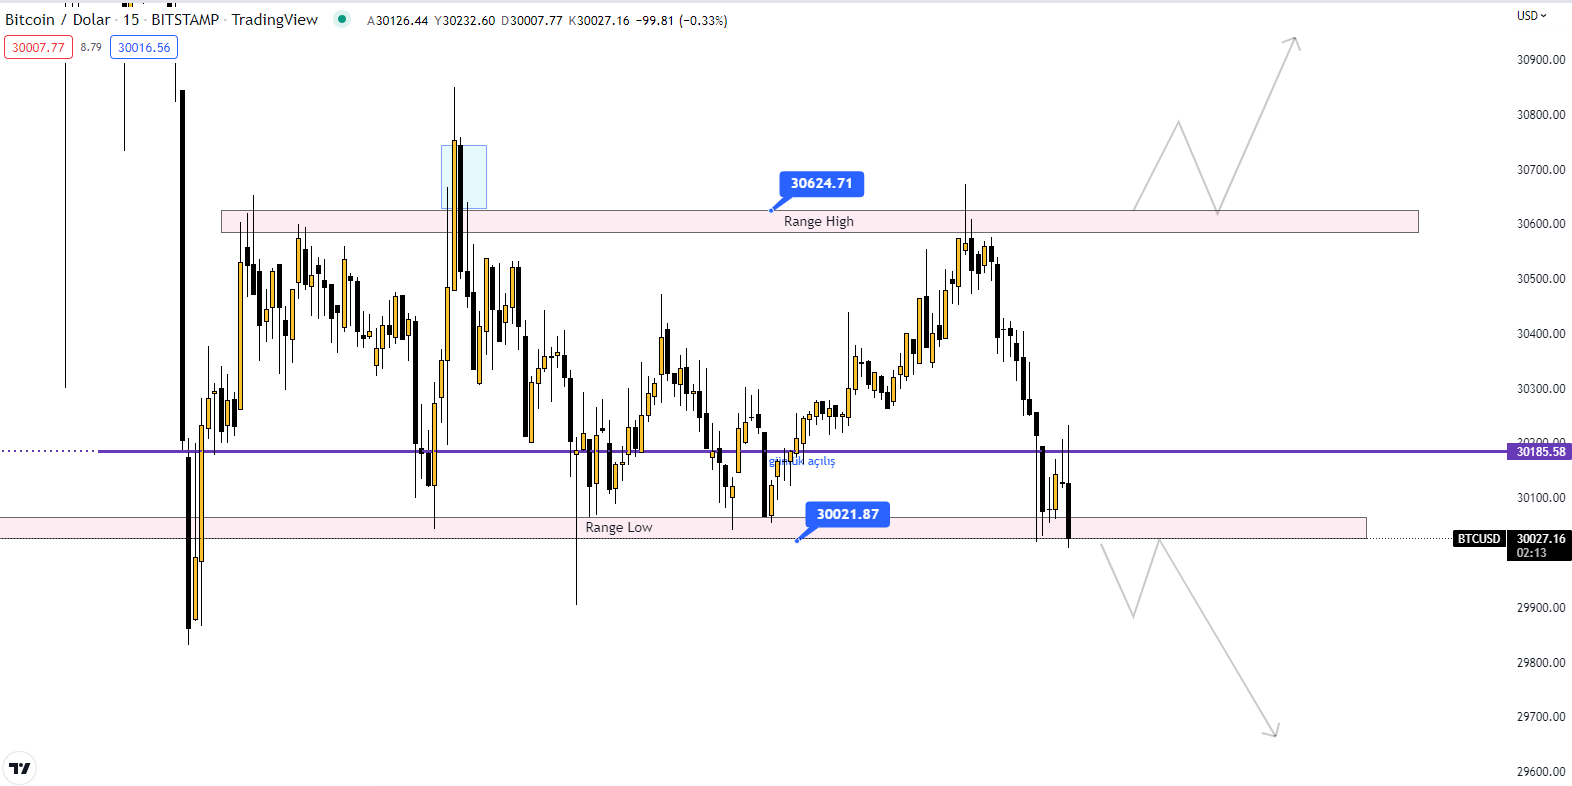
On the 15-minute chart of Bitcoin, it continues to move within a certain range. top of the range liquidity cleaning Bitcoin, which experienced a decline after making a move, moved upwards by exhibiting a similar movement in the lower region this time. Bitcoin, which has not yet made a new high peak, 30600-30700 while level resistance 29900-30000 level acts as a support. 30185 dollars Bitcoin, which opened the day with, is below this level at the time of writing.