If the Shiba Inu can post a confident weekly close above the middle band of the Bollinger Bands indicator, it could be poised for an explosive 493% rally towards the $0.00004 region.
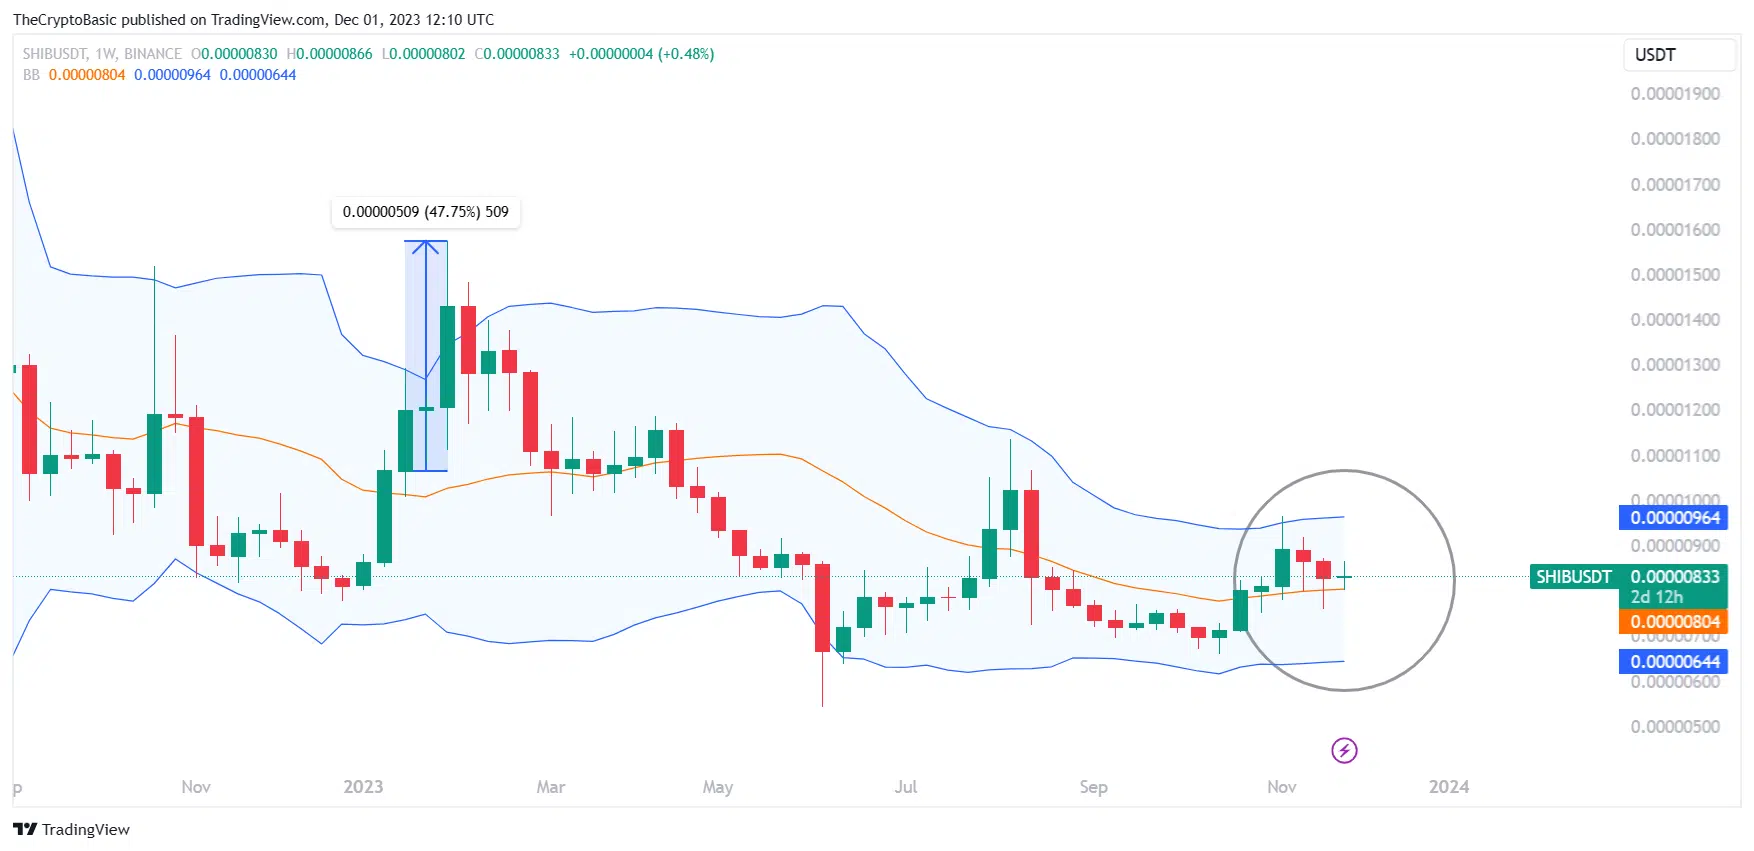
SHIB recorded five consecutive weekly green candles from mid-October to early November amid market-wide growth. However, after rising to $0.00000965, the price has underperformed over the past two weeks and the bears are trying to initiate a retracement of previous gains.
As Koinfinans.com reported, SHIB has lost more than 12% in value since November 13. This decline comes amid a lackluster situation in the broader market. However, while Bitcoin regained the $38,000 level, the Shiba Inu failed to capitalize on this rally for more significant growth. The reason for this is the selling pressure created by those who buy for profit.
Despite the selling pressure, SHIB is currently trading in a significant position indicating increasing bullish momentum. The asset is currently looking to post a confident weekly close above the middle band of the Bollinger Bands indicator – a move that could signal an imminent explosive rally.
The middle band of the Bollinger Bands indicator is a simple moving average (SMA) that represents the prevailing market trend. Prices above the middle band indicate an uptrend, and prices below indicate a downtrend. Transitions above or below the band may indicate potential trend changes.
Although Shiba Inu has recorded a few weekly closes above the mid-band, these closes have not been clearly realized. SHIB has made these bullish weekly closes only twice in the last two years. Each of these closes preceded an impressive rally.
This close was first reported in early October 2021, when SHIB closed the week at $0.00002613 while the middle Bollinger band was at $0.00000851. Shortly after this close was recorded, SHIB mounted a 939% rally from the beginning of October to the ATH of $0.00008845 at the end of October 2021.
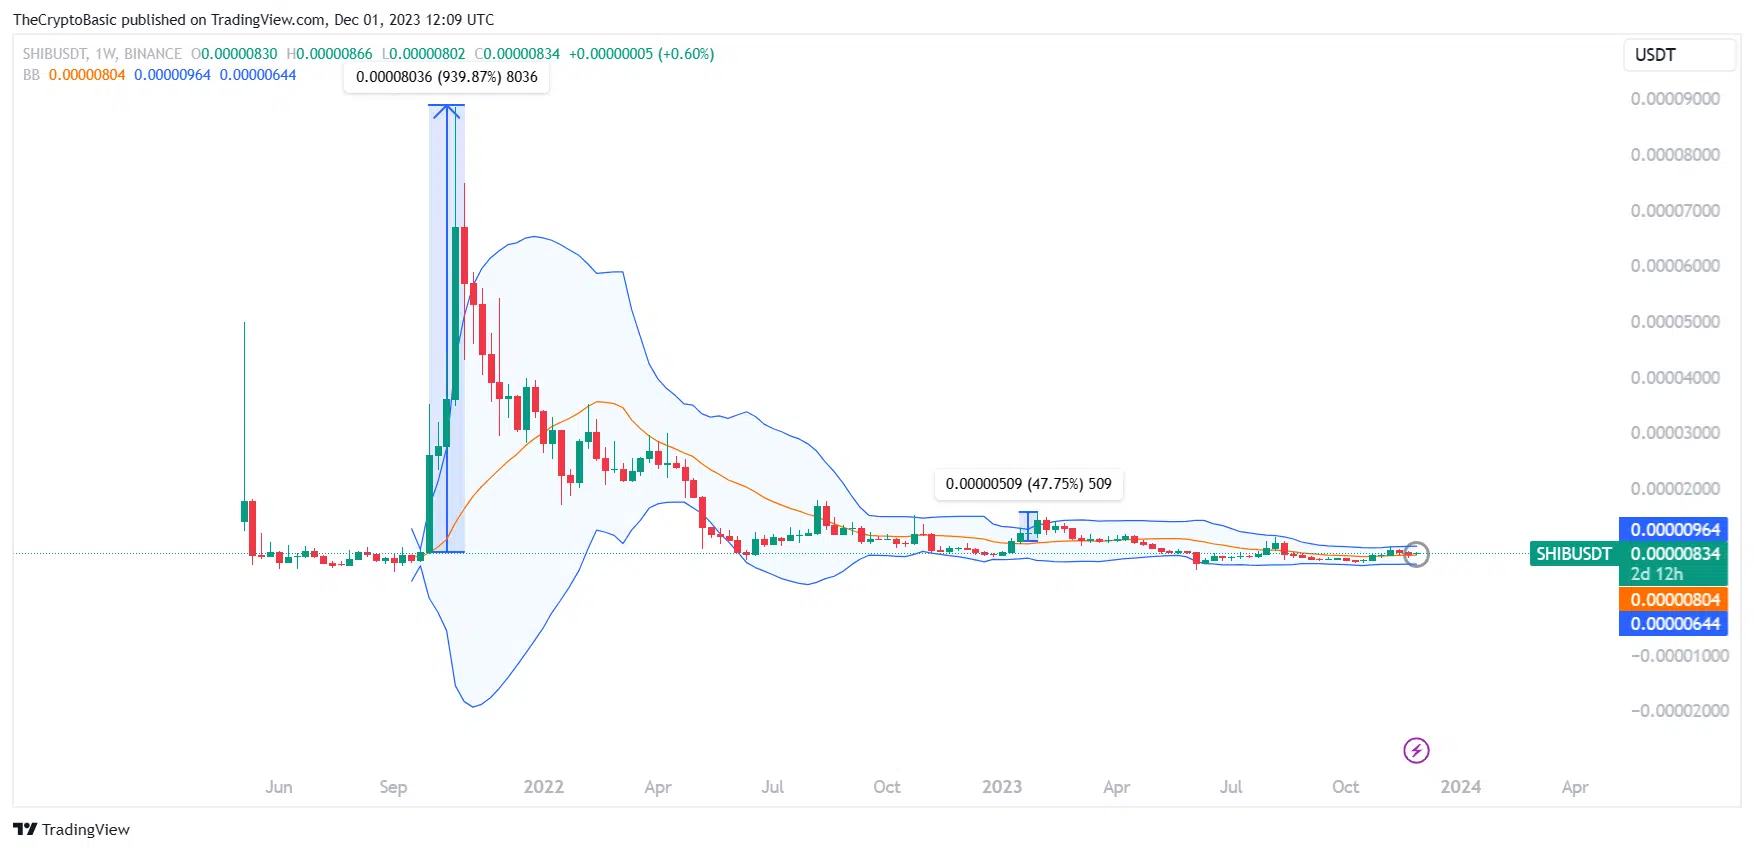
After its all-time high, the Shiba Inu continued to decline until it fell below the mid-band in January 2022. meme coinIt remained below the band until January 2023, when it recorded a second safe close. Following this second close, SHIB rose 47% to this year’s high of $0.00001575.
Although SHIB had recently recorded a similar bullish close above the mid-band, this was not a confident move. The asset now looks to repeat a close similar to the move in January. If this happens, SHIB could look to register a 493% increase from its current position.
This figure is the average of two surges recorded in October 2021 and February this year. Shiba Inu is currently trading at $0.00000833. An increase of 493% would result in a price of $0.0000410. SHIB last saw the $0.00004 price zone in November 2021.