
While JD, one of the popular analysts of the cryptocurrency world, determines the ideal levels for DCA purchases, XRP A price prediction extending to $3.8, pointing to a ‘continuous upward’ trend in price made.
JD’s analysis comes as the altcoin corrects some of the gains it accumulated on fake BlackRock iShares XRP ETF filing news. The altcoin approached the $0.75 level as the news trended, but this rise was quickly erased when reliable sources confirmed that the filing was fake.
Commenting more clearly on the turmoil caused by fake news, JD believes that XRP continues to trade within the range despite the price drop. This observation is relatively accurate, as the price has remained at the $0.63 to $0.69 level where it was trading before the ETF filing reports emerged.
According to JD, the price fell to the support level and has been holding up since then. The analyst highlighted that the altcoin has recorded higher highs and higher lows since then. This pattern confirmed that the asset continues to trade in an uptrend despite the recent correction.
XRP Continues Its Uptrend
Data from JD’s accompanying chart shows that the analyst maintains a bullish outlook for XRP in the long term. The chart shows a symmetrical triangle that has characterized the price movements of the altcoin since April 2021, after the price dropped from the $1.96 level.
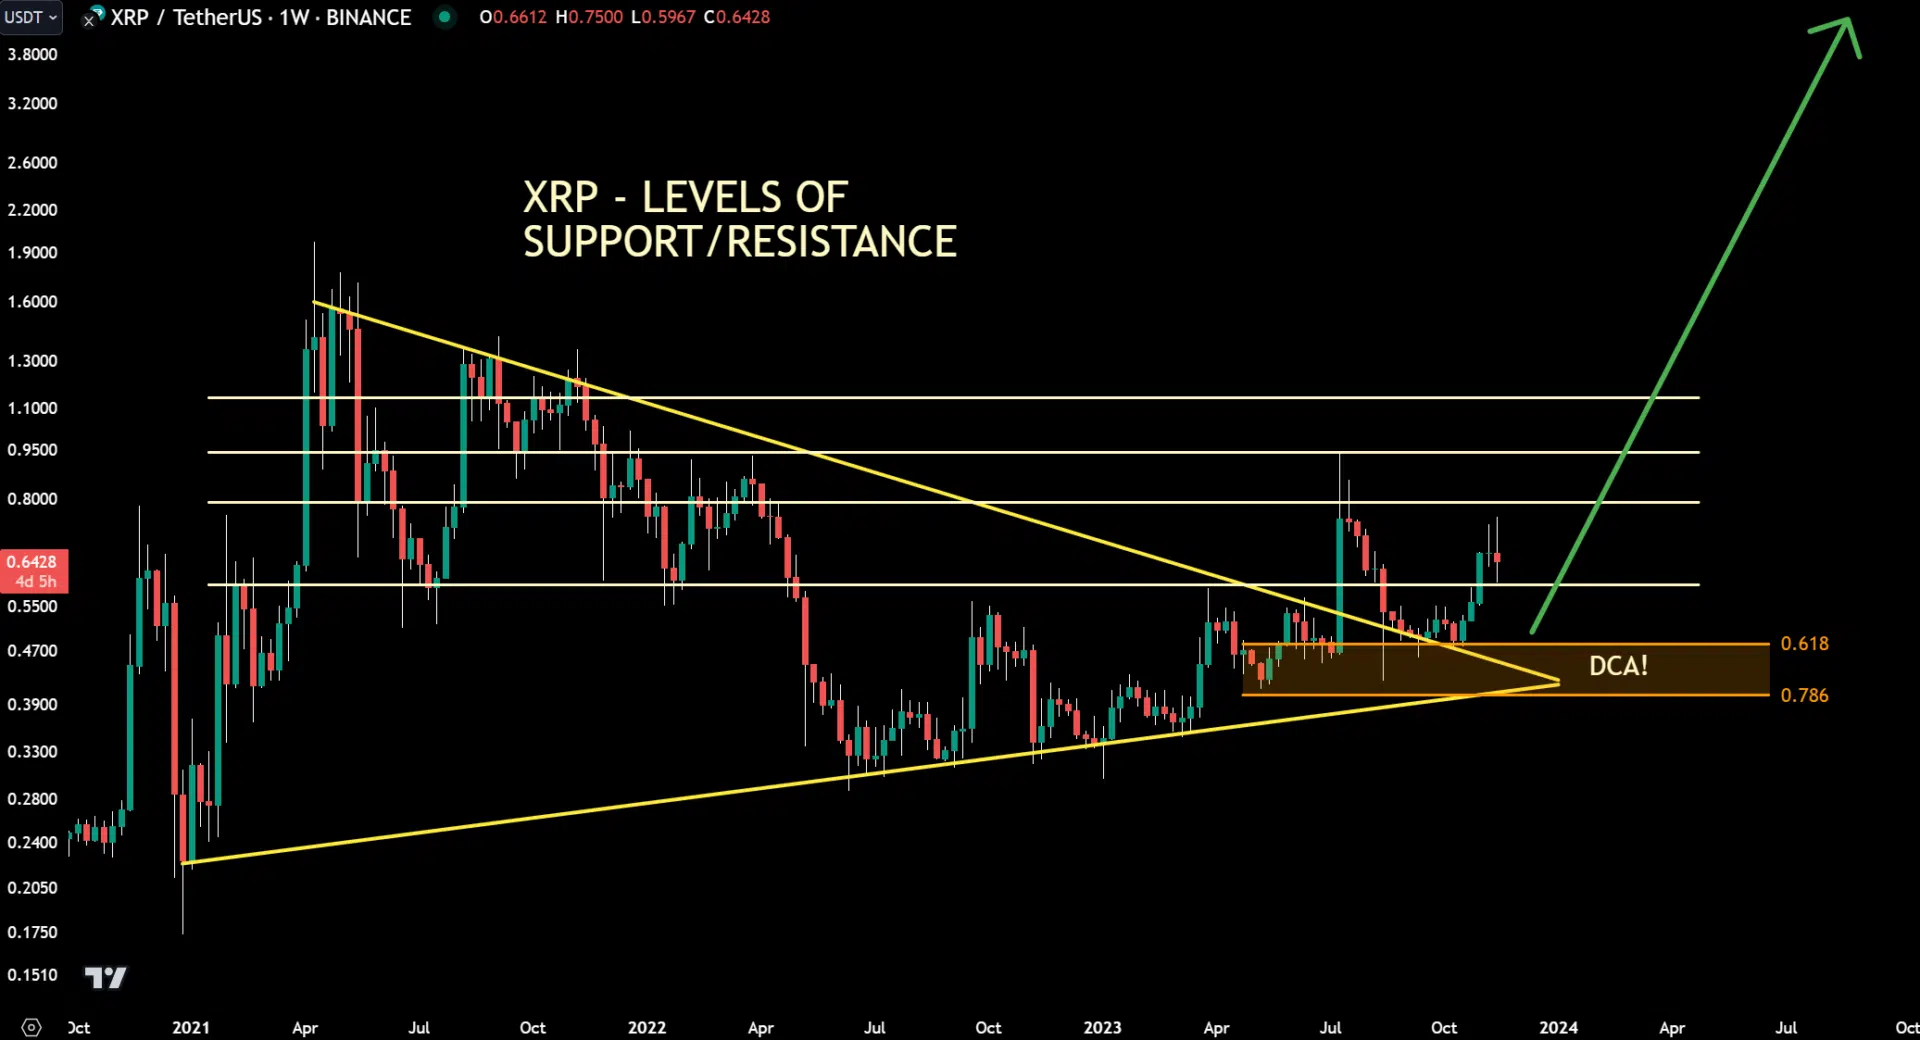
Since then, XRP has continued to record lower highs and higher lows, leading to the formation of the symmetrical triangle. However, it managed to break out of the triangle when it rose to $0.93 in July following the important decision in the Ripple and SEC case.
The correction in August led to the symmetrical triangle retesting its upper trend line. Following this retest, the price made another upward move, recording two consecutive bullish monthly closes in September and October. The asset continued this upward trend in November.
The recent declines could not suppress the current upward trend. The analyst’s chart predicts even more decline. If this were to happen, Fibonacci identified the area between 0.618 and 0.786 as the ideal area for dollar cost averaging. This zone lies between $0.4100 and $0.4770. However, in the long-term expectation, the final target is at $ 3.8. The first important resistance is at $0.8.