
Shiba Inuattracts attention with the rapid rises it records from time to time. However, it is noteworthy that some important metrics are now in the red. This is an important signal that SHIB may face a downward move.
As we reported as Koinfinans.com, although on-chain metrics change rapidly, the latest developments attract attention.
First of all, “Net Network Growth” decreased by 0.52%. This figure reflects the number of people joining or leaving SHIB, indicating the waxing and waning of users’ interest. Right now, it seems like fewer people are interested and the network in general is experiencing exits.
Secondly, another important metric to consider is the “In the Money” figure, which recorded a low of “-0.64%”. This statement means that investors are losing money by holding Shiba Inu assets. This is an important detail that may reduce the attractiveness of SHIB for long-term investors.
The “concentration” metric also showed a decrease of 0.11%. This shows that the Shiba Inu is no longer under the control of just a few large whales. The change in the amount controlled by whales can affect the price of SHIB because these players have a huge influence on the market.
Another important signal was the “Large Transactions” metric, which showed a sharp decline of 11.69%. Large transactions often reflect the activity of whales, and this decline may signal a waning interest from these major players.
The fifth metric shows the imbalance between buy and sell orders, with sell orders taking more market share. This increase in sell orders could put downward pressure on the Shiba Inu price and support a downward trend.
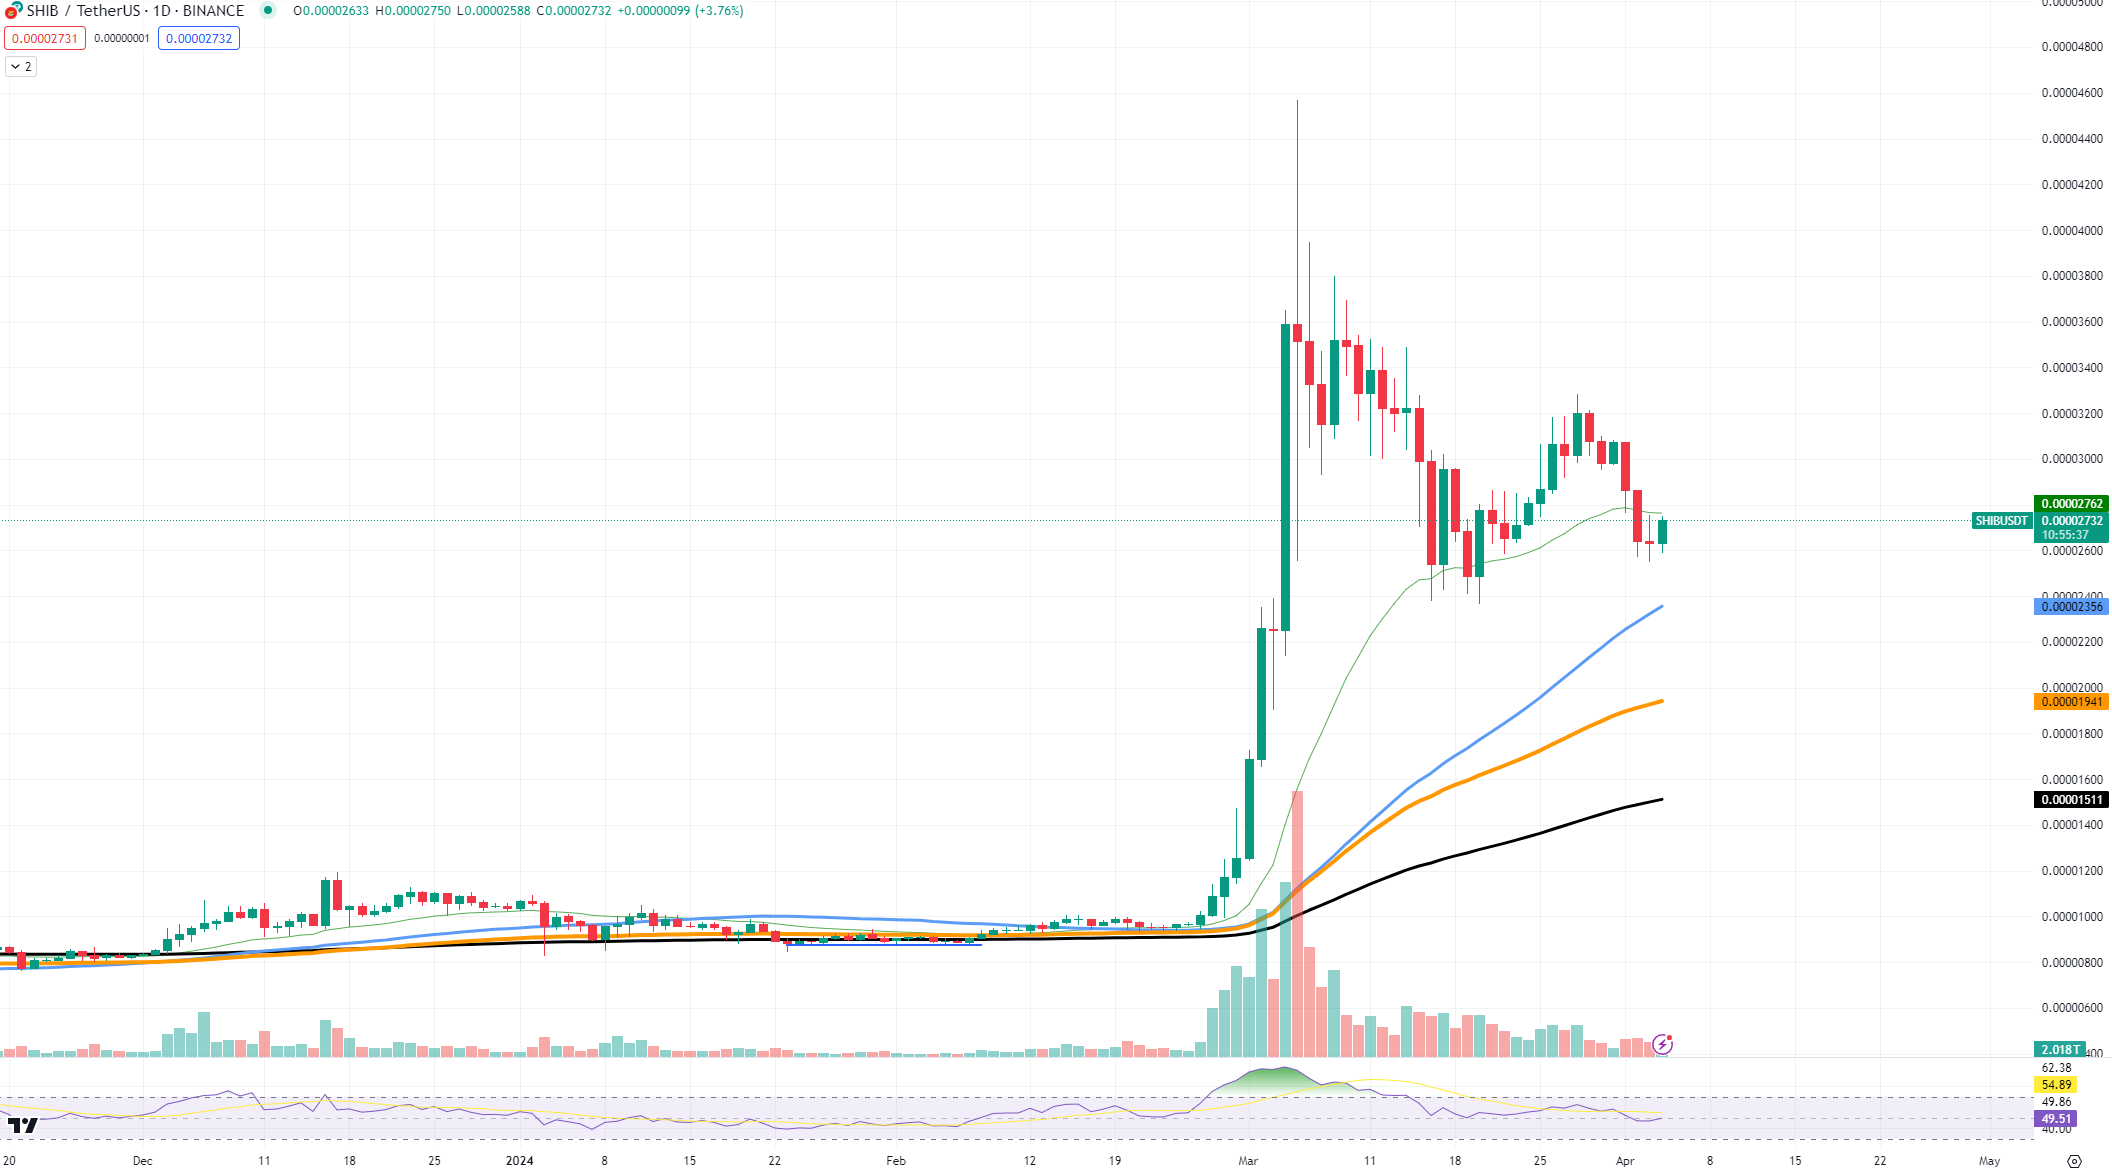
Currently, SHIB is trading at approximately $0.00002773. The support level to watch is located near the blue line (50 EMA), around $0.00002256, and could provide a safety net when prices drop.
The next level of resistance is the $0.00003 threshold, which most likely serves as a psychological level for holders of the asset. These levels should be followed carefully by investors to monitor price movements and identify potential support and resistance points.
