
Bitcoin threatens to break the narrow gap to the downside. Cryptocurrency markets seem to be taking cues from the United States stock markets, which have been falling for two days amid uncertainty over debt ceiling negotiations. While the near term is uncertain, traders should be prepared for a sharp reversal in price if debt ceiling talks work. So, what are the key support and resistance levels in Bitcoin and major altcoins? Here are analyst Rakesh Upadhyay’s predictions for MATIC, SOL, DOT and many coins
Forecasts for MATIC and 9 coins came from the analyst
Bitcoin price analysis
According to the analyst, Bitcoin reached the 20-day exponential moving average (EMA) of $27,278 on May 23. However, the bulls could not overcome this resistance. This failure resulted in aggressive selling by the bears on May 24. The bears are attempting to keep the price below the immediate support at $26,631. If they are successful, the BTC/USDT pair could drop to the vital support at $25,250. This level can again witness a tough battle between bulls and bears. If the bears peak, the selling could intensify and the pair could drop to the psychologically important $20,000 level.
The 20-day EMA remains the key resistance that the bulls must conquer if they want to start a sustained recovery. A short-term trend change is likely to be signaled after the bulls push the price above the resistance line.
Ethereum price analysis
Ethereum broke above the 20-day EMA ($1,830) on May 23, but the bulls were unable to sustain the upward move on May 24. The Bears pulled the price back below the 20-day EMA on May 24. This indicates that the ETH/USDT pair may continue to trade within the falling wedge formation for a few more days. A break below the wedge will indicate the start of a deeper correction. An initial support on the downside is at $1,600, but if it fails to hold, the pair could slide as low as $1,352. Conversely, if the price rises and breaks above the wedge, it will mark the start of a new upward move. The pair could rally to $2,000 and then $2,200.

BNB price analysis
BNB reached the 20-day EMA ($313) on May 23, but the bulls were unable to break through. This may have attracted the selling of aggressive bears on May 24. Sellers will try to increase their dominance by pulling the price below the psychological support at $300. The next level to watch on the downside is the support line of the descending channel formation. If this level breaks down, the BNB/USDT pair could slide as low as $280.

Alternatively, if the price turns up from the current level or recovers from the support line, it will suggest buying lower. The bulls will then try to push the price above the 20-day EMA and challenge the resistance line.
XRP price analysis
After trading between moving averages for the past few days, XRP dropped below the 20-day EMA ($0.45) on May 24. If the bears continue to hold the price below the 20-day EMA, a few short-term bulls could empty their positions. This could lead the price to drop to the key $0.40 support. Buyers are likely to defend this level aggressively because if they fail to do so, the XRP/USDT pair could drop to $0.36.

This negative view could be invalidated in the near term if the price rises from the current level and reaches $0.47 above the 50-day simple moving average (SMA). This could open the way for a possible rise to $0.54 and then to $0.58.
Cardano price analysis
Cardano’s rebound from the uptrend line on May 22 changed direction from the 20-day EMA ($0.37) on May 24. It showed that the bears were trying to take control. The bears will try to push the price below the uptrend line. If they do, they will invalidate the ascending triangle pattern. The ADA/USDT pair could start a deeper correction towards $0.30 later. Because time is running out for the bulls, according to the analyst. They will need to quickly push the price above the 20-day EMA if they want to avoid a decline. The pair could then rise to the 50-day SMA ($0.39), which could act as a strong barrier. A break above this level will open the doors for a potential rally to $0.44.

Dogecoin price analysis
The bulls failed to push Dogecoin to break above the 20-day EMA ($0.07) on May 22 and 23, indicating that sentiment remains downside and rallies are sold out. The bears will try to push the price below the immediate support at $0.07. If they are successful, it will indicate that the next leg of the downward move has begun. The DOGE/USDT pair could slide down to the next support at $0.06. Contrary to this assumption, if the price turns up from $0.07, it will suggest a strong buy on the downside. A break and close above the 50-day SMA ($0.08) will indicate that the pair may continue to oscillate between $0.11 and $0.07 for a while.

Polygon price analysis
Polygon’s recovery faced solid resistance at the 20-day EMA ($0.89). This shows that the bears are selling on every small rise. The downward sloping moving averages and the relative strength index (RSI) in the negative zone increase the probability of a dip below $0.82. If this happens, the MATIC/USDT pair could decline to the strong support at $0.69.

However, if MATIC turns up from the current level or $0.82 support, it will signal demand at lower levels. A MATIC rally above the $0.91 to $0.94 zone will mark the beginning of a sustained recovery that could reach the downtrend line.
Solana price analysis
The bulls pushed Solana above the $19.85 level in May, but failed to sustain higher. This indicates that the bears continue to sell in minor relief rallies. The bears pulled the price close to the vital support at $18.70 on May 24. This level is likely to attract buyers, but if the next bounce fails to break above $20, the SOL/USDT pair could extend its decline to $16. On the upside, a break and close above the 20-day EMA ($20.57) would be the first sign of strength. It will show that the selling pressure is decreasing. The pair might try to rise to $24 later.

Polkadot price analysis
The bears sold the recovery up to the 20-day EMA ($5.43) on May 23, showing that they are not willing to give up their advantage on Polkadot. The downward sloping 20-day EMA and the RSI in the negative zone indicate that the path of least resistance is to the downside. Sellers will try to further strengthen their positions by pulling the price below the $5.15 support.
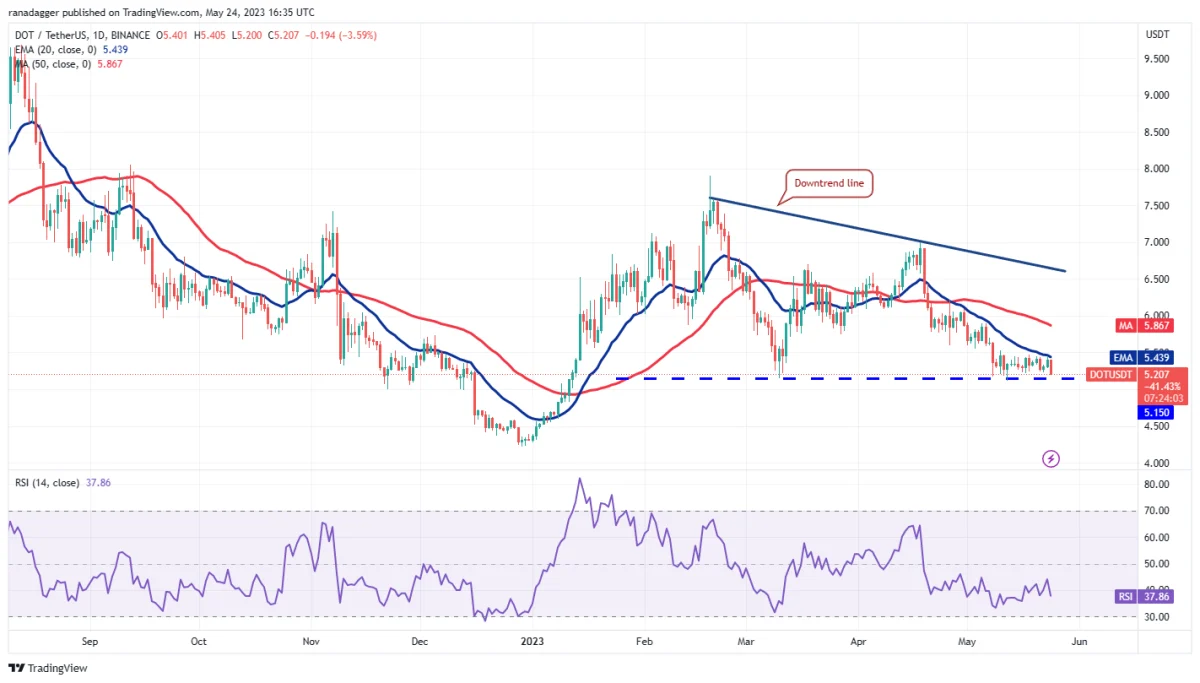
If they do, the DOT/USDT pair could start the next leg of the downside move towards $4.22. If the bears want to avoid the decline, they will need to quickly push the price above the 20-day EMA. This could trigger a rally towards the 50-day SMA ($5.86).
Litecoin price analysis
Litecoin plunged sharply and broke below the moving averages on May 24, showing that the bears had prevailed over the bulls. The bears will then try to push the price towards the strong $75 support. This level is likely to attract strong buys by the bulls. If the price rebounds from $75, it will indicate that the LTC/USDT pair could stay between $75 and $96 for a while.

A break above or below this range could initiate the next trend move. If the bears sink the price below $75, the pair could slide as low as $65. Conversely, if buyers initiate a recovery and push the price above $96, it will indicate the start of a rise towards $106.
Contact us to be instantly informed about the last minute developments. twitter‘in, Facebookin and InstagramFollow and Telegram And YouTube join our channel!
Risk Disclosure: The articles and articles on Kriptokoin.com do not constitute investment advice. Bitcoin and cryptocurrencies are high-risk assets, and you should do your due diligence and do your own research before investing in these currencies. You can lose some or all of your money by investing in Bitcoin and cryptocurrencies. Remember that your transfers and transactions are at your own risk and any losses that may occur are your responsibility. Cryptokoin.com does not recommend buying or selling any cryptocurrencies or digital assets, nor is Kriptokoin.com an investment advisor. For this reason, Kriptokoin.com and the authors of the articles on the site cannot be held responsible for your investment decisions. Readers should do their own research before taking any action regarding the company, assets or services in this article.
Disclaimer: Advertisements on Kriptokoin.com are carried out through third-party advertising channels. In addition, Kriptokoin.com also includes sponsored articles and press releases on its site. For this reason, advertising links directed from Kriptokoin.com are on the site completely independent of Kriptokoin.com’s approval, and visits and pop-ups directed by advertising links are the responsibility of the user. The advertisements on Kriptokoin.com and the pages directed by the links in the sponsored articles do not bind Kriptokoin.com in any way.
Warning: Citing the news content of Kriptokoin.com and quoting by giving a link is subject to the permission of Kriptokoin.com. No content on the site can be copied, reproduced or published on any platform without permission. Legal action will be taken against those who use the code, design, text, graphics and all other content of Kriptokoin.com in violation of intellectual property law and relevant legislation.