
Crypto analyst David says that the SUI price, which has been rising strongly recently, will undergo a correction. Analyst Valdrin Tahiri expects a 15 percent decline from LTC. We have compiled analysts’ technical analyzes for these 2 altcoins for our readers.
SUI price prediction: Altcoin price broke the short-term formation!
Sui (SUI) price broke above the important horizontal resistance zone at $1.25 during the week of January 22-28, 2024. In the process, the token price reached an all-time high of $2 last week. However, the weekly candles after the breakout all have long upper wicks. Moreover, the volume gradually decreased. These are all signs of weakness.
In fact, SUI price was rejected by the resistance zone at $2 last week from its all-time high (red arrow). Meanwhile, the weekly RSI is falling below 70 and is sloping downwards. This is another sign of weakness. If SUI continues to decline, a key support zone to watch is $1.25, which is 24.39% off the current price.
The most likely scenario suggests that the SUI price will experience a correction in the near future. The nearest target for the altcoin is $1.40. Additionally, SUI price could potentially drop towards $1.25. However, the bearish view will be invalidated if SUI breaks the resistance zone above $2.
LTC price prediction: Is the trend still in favor of the bears?
The LTC price has been trading without significant volatility for nearly a year now. How long will this trend continue? Weekly time frame technical analysis shows that LTC has been rising along a rising support trend line since June 2022. While the weekly time frame is uncertain, the daily chart is showing a bearish trend due to LTC price action.
Since September 2023, the movement has been in an ascending parallel channel. This is a sign that the increase is corrective. Additionally, significant overlap within this formation indicates a corrective increase. Finally, LTC price is trading at the bottom of the channel. Also, the RSI is falling below 50. If LTC breaks out of the channel, it is likely to drop 15% to the next closest support at $58.
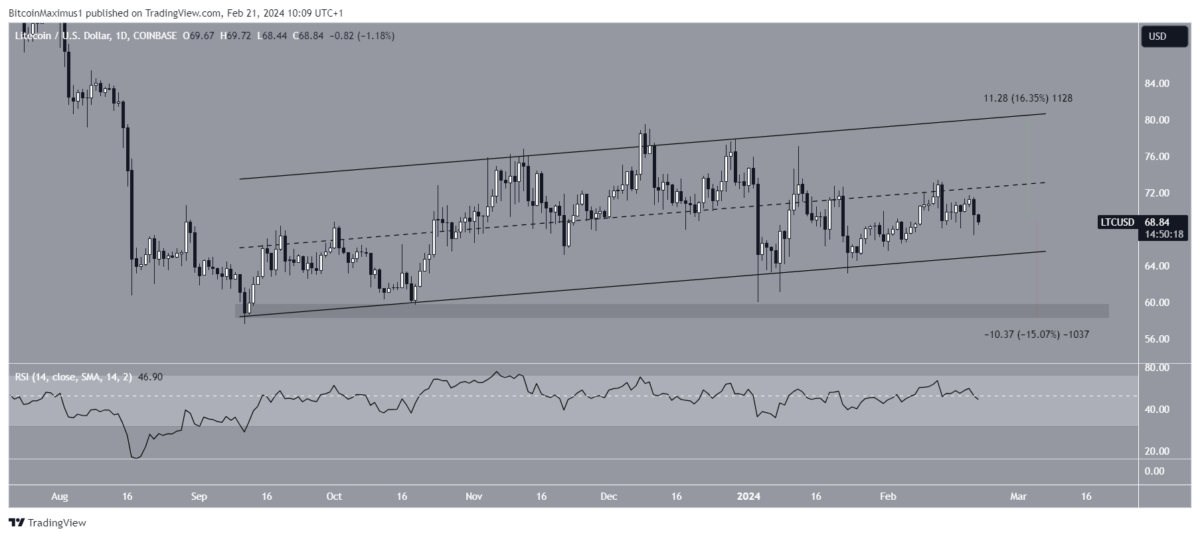
Despite this bearish LTC price prediction, a break above the middle line of the channel could trigger a 16% rally towards the $80 resistance trend line.
The opinions and predictions in the article belong to the analysts and are definitely not investment advice. cryptokoin.com We recommend that you do your own research before investing.
To be informed about the latest developments, follow us twitter‘in, Facebookin and InstagramFollow on and Telegram And YouTube Join our channel!