
Litecoin (LTC) price is currently showing bullish signals against Bitcoin. This leads to speculation of a potential significant upside move for LTC.
However, despite these promising indicators, the initial trends observed this month have been downward. Therefore, although bullish signals are intensifying about the possibility of a sharp increase in the LTC price, current market conditions require a cautious approach.
Litecoin’s Tough Month: Drops 37.3% Amid Market Turbulence
The LTC price has fallen significantly by over 37.3% this month, following its local peak around $113. LTC is trending around the golden ratio support level at around $80. Therefore, it offers a potential opportunity for upside.
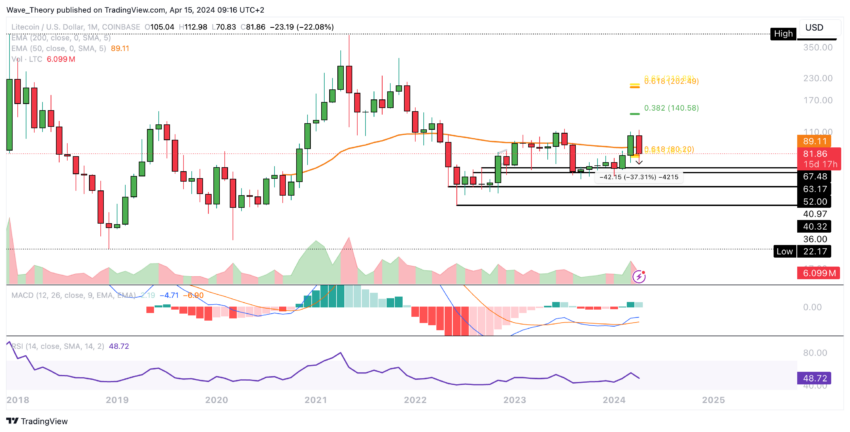
Additionally, the Moving Average Convergence Divergence (MACD) lines have formed a bullish crossover on the monthly chart. However, the MACD histogram has started to enter a bearish trend while the Relative Strength Index (RSI) remains in the neutral zone.
Weekly Chart Analysis: Golden Ratio as a Strong Support Level
Last week, LTC price initially fell below the Golden Ratio support level around $80. However, the price fully recovered to this critical support level by the close of the week.
This shows that there is an upward movement potential in the current week. However, the MACD histogram on the weekly chart is pointing to bearish signals since the previous week.
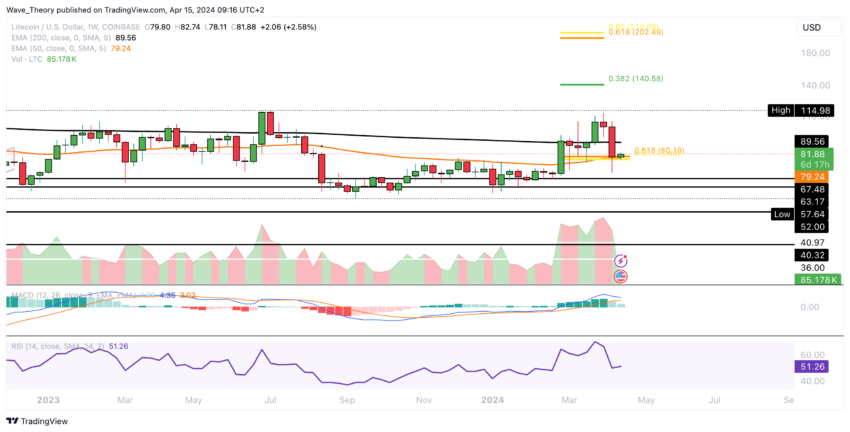
A possible downtrend is observed on the MACD lines in the near future. Additionally, the Exponential Moving Averages (EMAs) are exhibiting a death cross pattern on the weekly chart, indicating a medium-term bearish trend.
However, the RSI (Relative Strength Index) remains in the neutral zone. This does not provide a clear indication of bullish or bearish momentum.
Litecoin’s Positive Signal: Gold Transition Continues on Daily Chart
A golden crossover continues on Litecoin’s daily chart, indicating a sustained uptrend in the short to medium term. However, a recent bearish trend has been seen in the MACD lines.
At the same time, the MACD histogram is showing bullish momentum today, while the RSI remains neutral. There are two significant obstacles to LTC’s trajectory.
Initial resistance lies near $89.4 coinciding with the 50-day EMA. Additionally, significant Fibonacci resistance looms around $97.
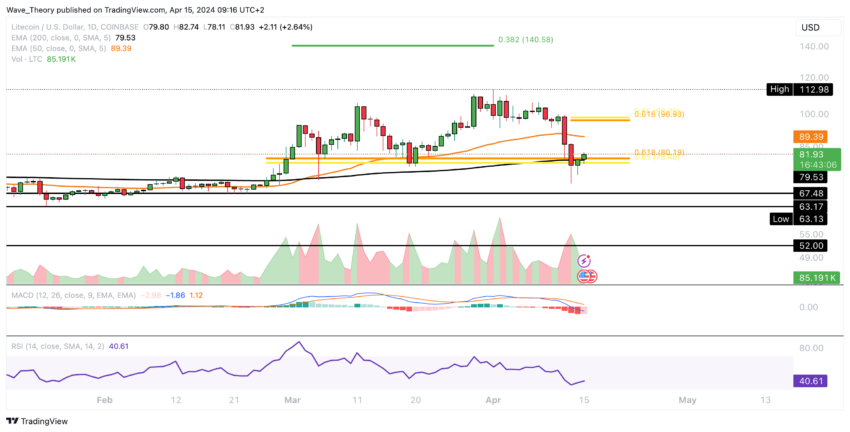
Exceeding the golden ratio at $97 will indicate the completion of the corrective phase. In this context, it would potentially pave the way for LTC to target the 0.382 Fib resistance at around $140.
Conversely, if LTC experiences downward pressure, significant support is expected between $63 and $67.5.
Bearish Signal: Litecoin’s 4H Chart Shows Death Cross Formation
An upward trend towards the Golden Ratio level of approximately $97 indicates a potential upside of approximately 18%. Notably, the MACD lines on the 4H chart have recently turned bullish along with a bullish divergence in the MACD histogram.
Meanwhile, the RSI remains in the neutral zone. Short-term expectations support the upward trend.
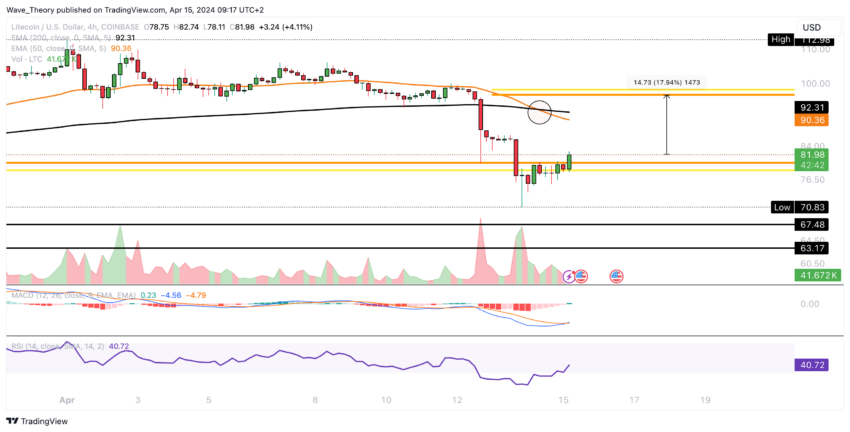
However, highlighting the ongoing corrective phase, it is important to recognize that the trend has already been confirmed as a downtrend by the death cross of the EMAs.
Litecoin and Bitcoin: The Silver Lining Revealed in Price Dynamics
Despite the significant bearish trend in LTC price versus Bitcoin, there are indications of a potential reversal. Notably, the MACD lines are showing a bullish divergence on the weekly chart, while the RSI is pointing to a bullish divergence.
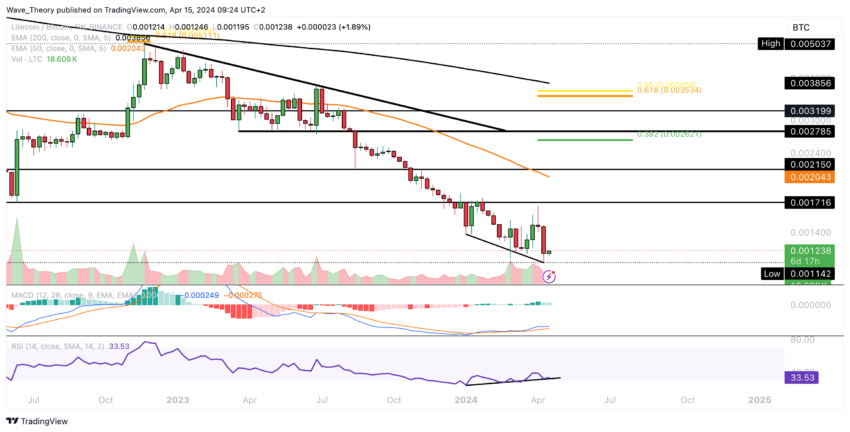
If Litecoin enters an upward trajectory, it will face significant resistance levels between approximately 0.001716 BTC and 0.00215 BTC. Additionally, the 50-week EMA forms a formidable barrier around 0.00204 BTC.
