Bitcoin’s return to $60,000 levels after breaking its peak has made some investors nervous. While not being able to stay above the previous peak is technically a sign of weakness, some on-chain data shows that Bitcoin is still in the accumulation phase and preparing for its real rally.
Wallets Holding Short-Term Bitcoin Have Started Accumulating
In this analysis, we will benefit from Glassnode data, which graphs in-chain data and makes it available to users.
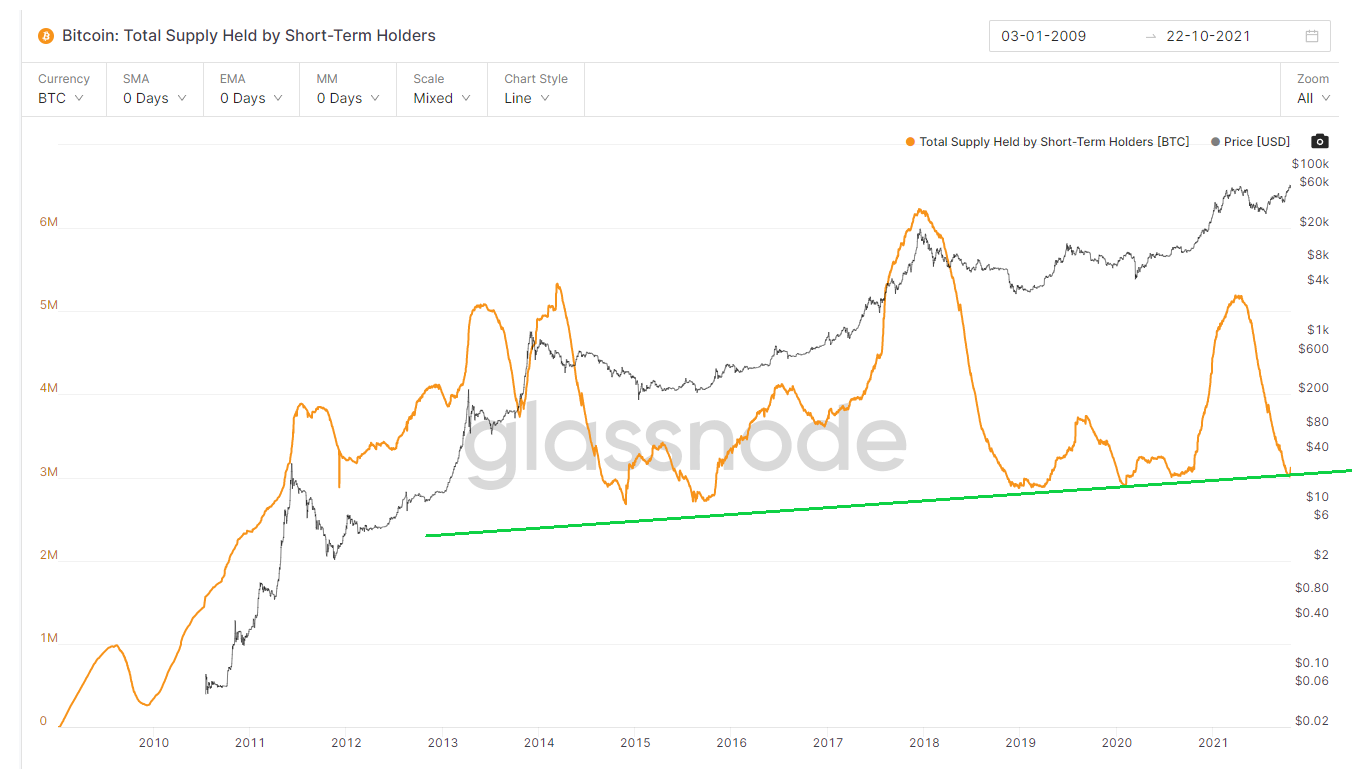
When we look at the amount of supply in the hands of wallets holding short-term Bitcoin, it is seen that it has started to rise again by resetting.
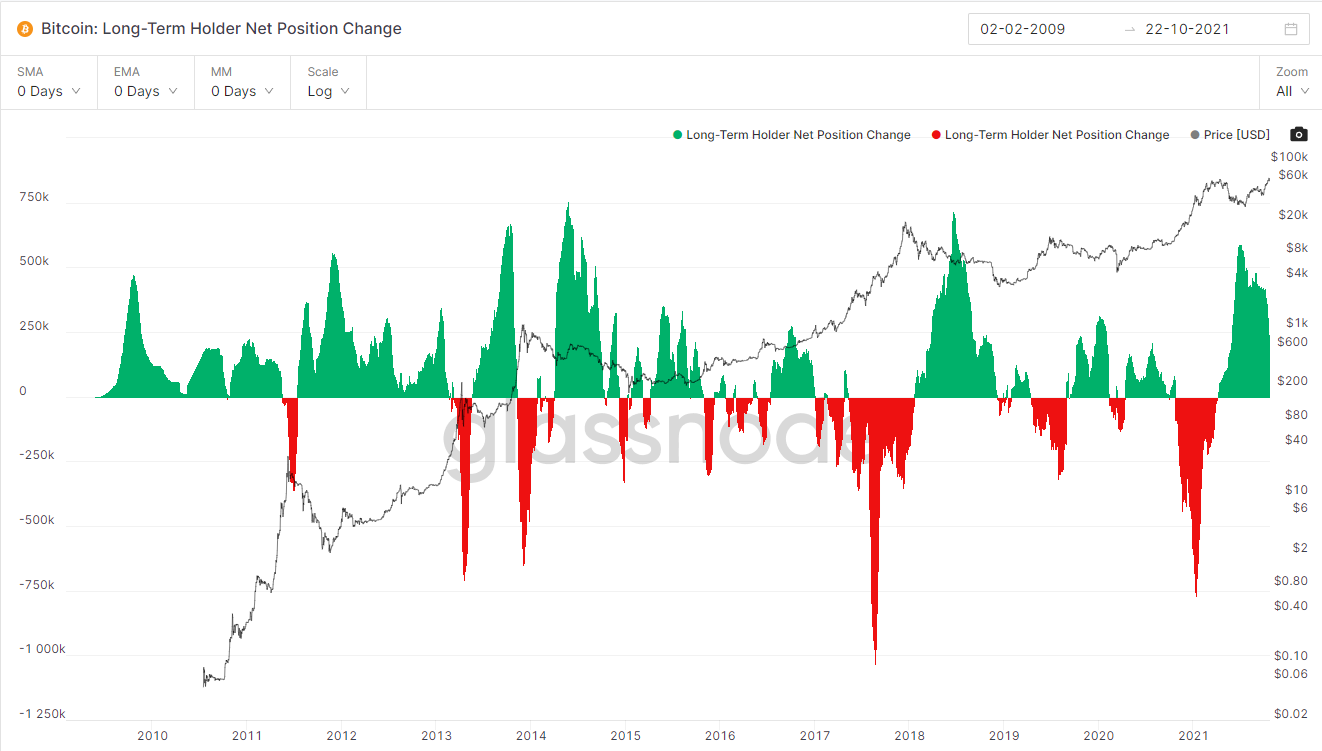
In fact, the selling pressure in Bitcoin comes largely from short-term investors. Because we see that wallets holding long-term Bitcoin continue to accumulate.
We mentioned in our post on September 1 that this sales pressure is close to being reset. When we look at the current version of the chart, we see that the accumulation phase has started again. We will be monitoring whether this accumulation will continue or not.

The supply of short-term Bitcoin holding wallets is about to reset, do you see what happens when they start accumulating again?#Bitcoin #BTC #cryptocurrency pic.twitter.com/VsiJVZUn0e
— Bitcoin System (@bitcoinsystem) September 1, 2021
Wallets Holding Long-Term Bitcoin Continue to Accumulate!
We observe that wallets holding long-term Bitcoin continue to accumulate Bitcoin since the peak of Bitcoin. Actually, this data works a little in reverse. Because wallets that hold long-term Bitcoin are usually large whales, they reduce the price and save by buying the property in the hands of the small investor. When these whales are going to sell, they push the price up and dump the goods on the small investor. This inverse correlation is also evident from the graph.

For the price to rise significantly, these whales need to decide to sell their BTC and drive the price higher to find buyers. In the current version of the chart, we see that the accumulation trend has started to decrease. However, they are still not in the sales territory. This shows that we will experience a fluctuating rise rather than a linear rise in the short term. Investors who work with these investors, dividing the risk and picking up from the bottom, can always be on the right side by unloading the item when they raise the price to sell. However, you should remember that this strategy requires patience and willpower.
Wallets In The Snow Are In The Red Zone
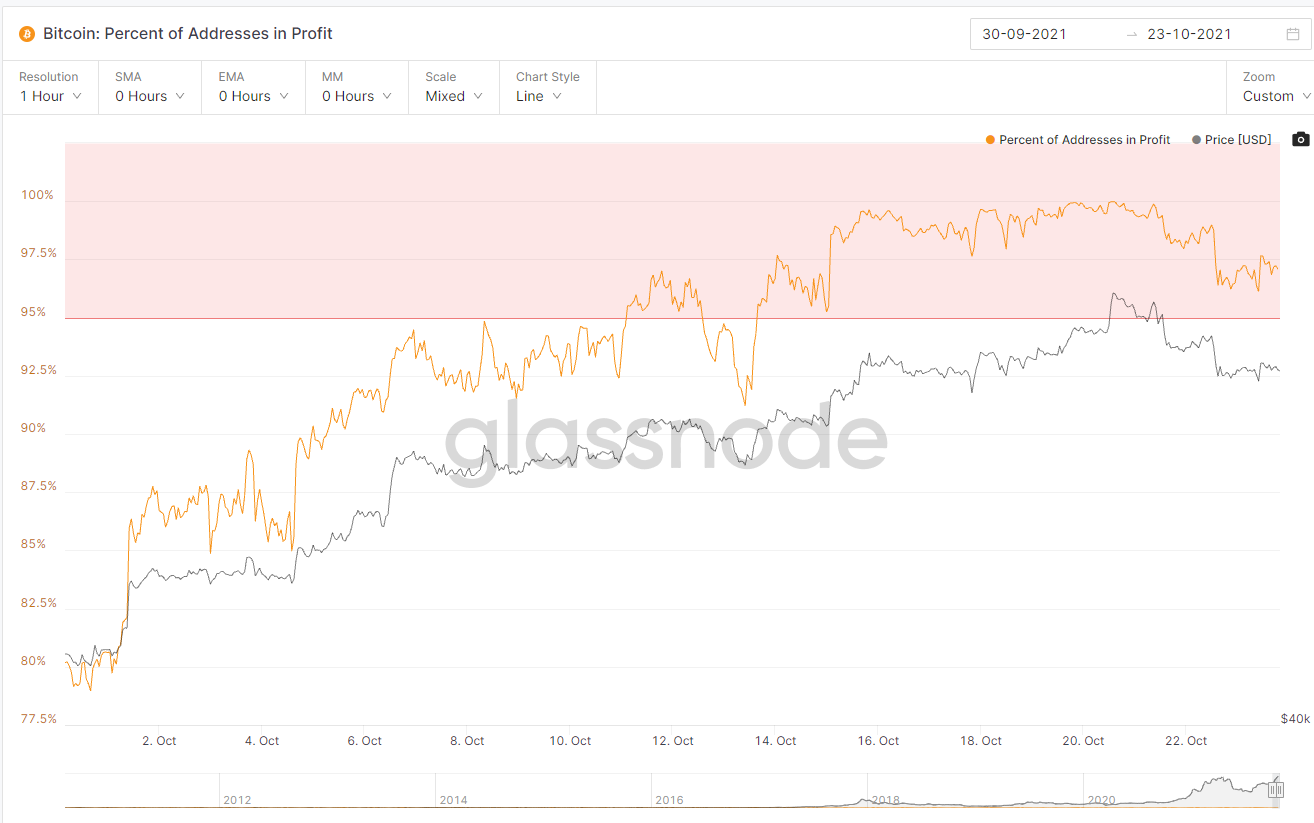
We see that we had a profit sale at $67,000 after the wallets that were in profit according to the purchase price went into the red zone. We have stated in our previous analyzes that this is an acceptable sale.
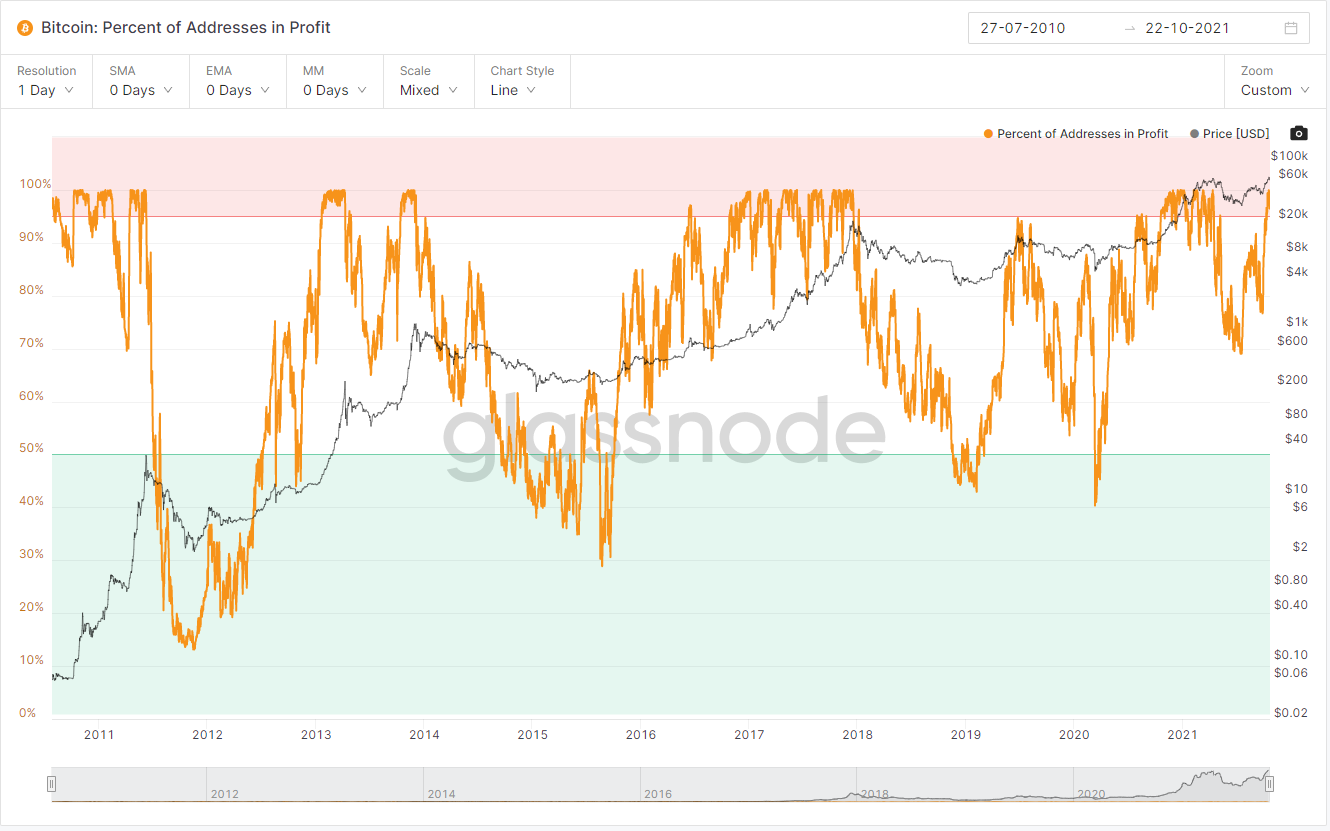
When we look at the 2020-2021 rally, we see that we have 7 months left by zigzagging (corrections) in the red zone. Although this data suggests that we should be wary of profit selling and that the correction may continue in the short term, it shows that we still have a long way to go in the medium term.
Current state of the chart:

All times:

This data is prepared to help you understand what is going on in the market. A direct rise or fall should not be expected. On-chain data does not provide precise data on short-term price movements.
*Not Investment Advice.
If you want to share the analysis of the graphics (by specifying which data) that you cannot reach on Glassnode and that you think are important, you can write it as a comment below.
