Unlike the maps that provide limited information in textbooks, what you will see below is much more efficient and enjoyable to review.
While examining these maps, you may want to say, “I wish they taught these in schools”. After all, you’re tired of maps showing which ore is mined from where. However, if information other than geographical shapes are given in the lessons, the students’ perspective can be much broader.
Until the education system understands this, at least for now, let’s continue to present them to you. Here are those maps with interesting information and statistics:
1. In red countries, traffic flows from the right, while in blue countries, it flows from the left.
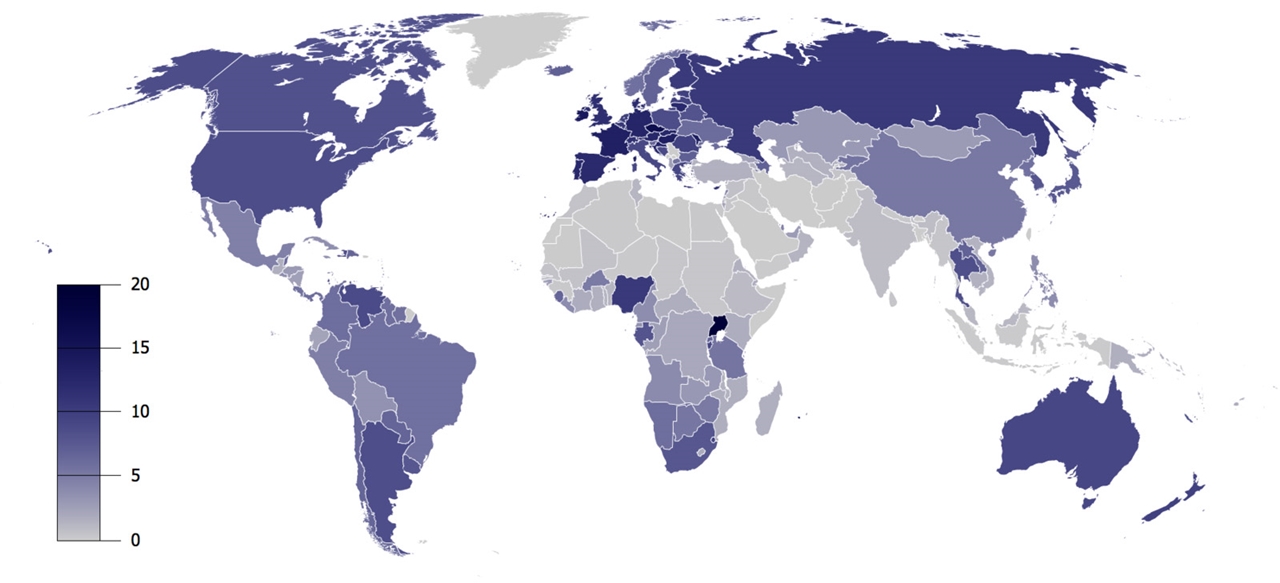
2. Countries that consume the most alcohol
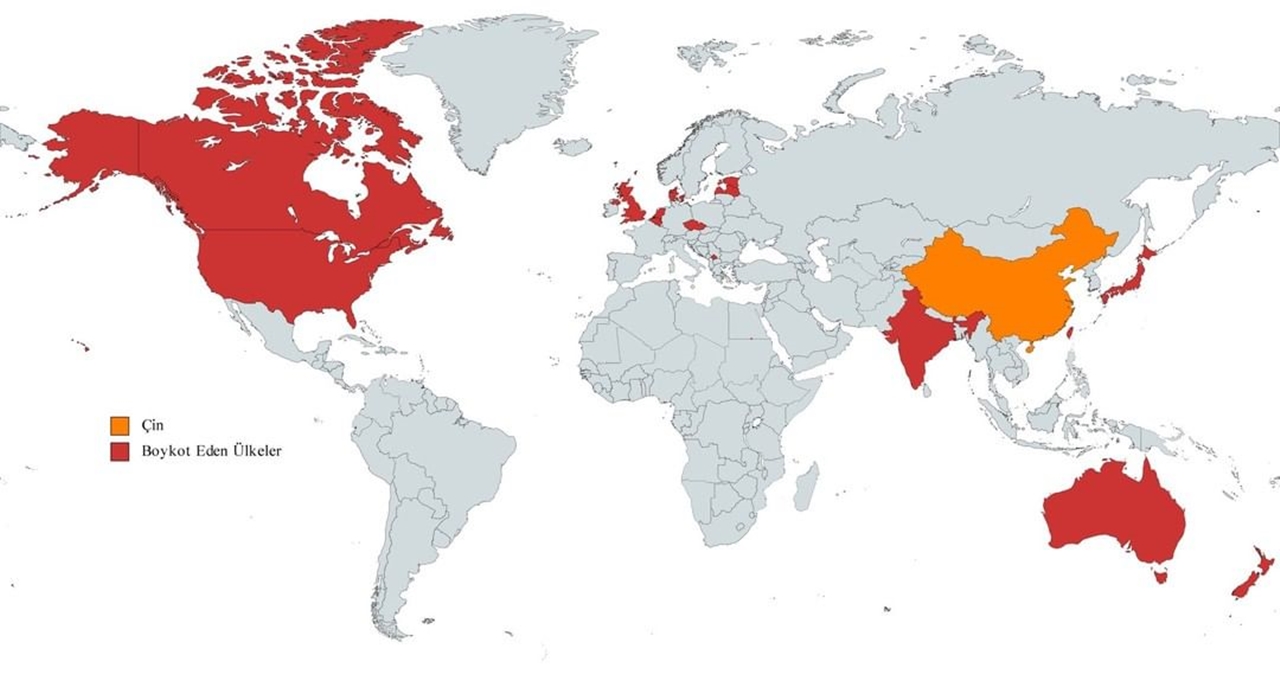
3. Countries boycotting the 2022 Chinese Winter Olympics. Many of the boycotting countries cite the human rights violations in East Turkestan as the reason.
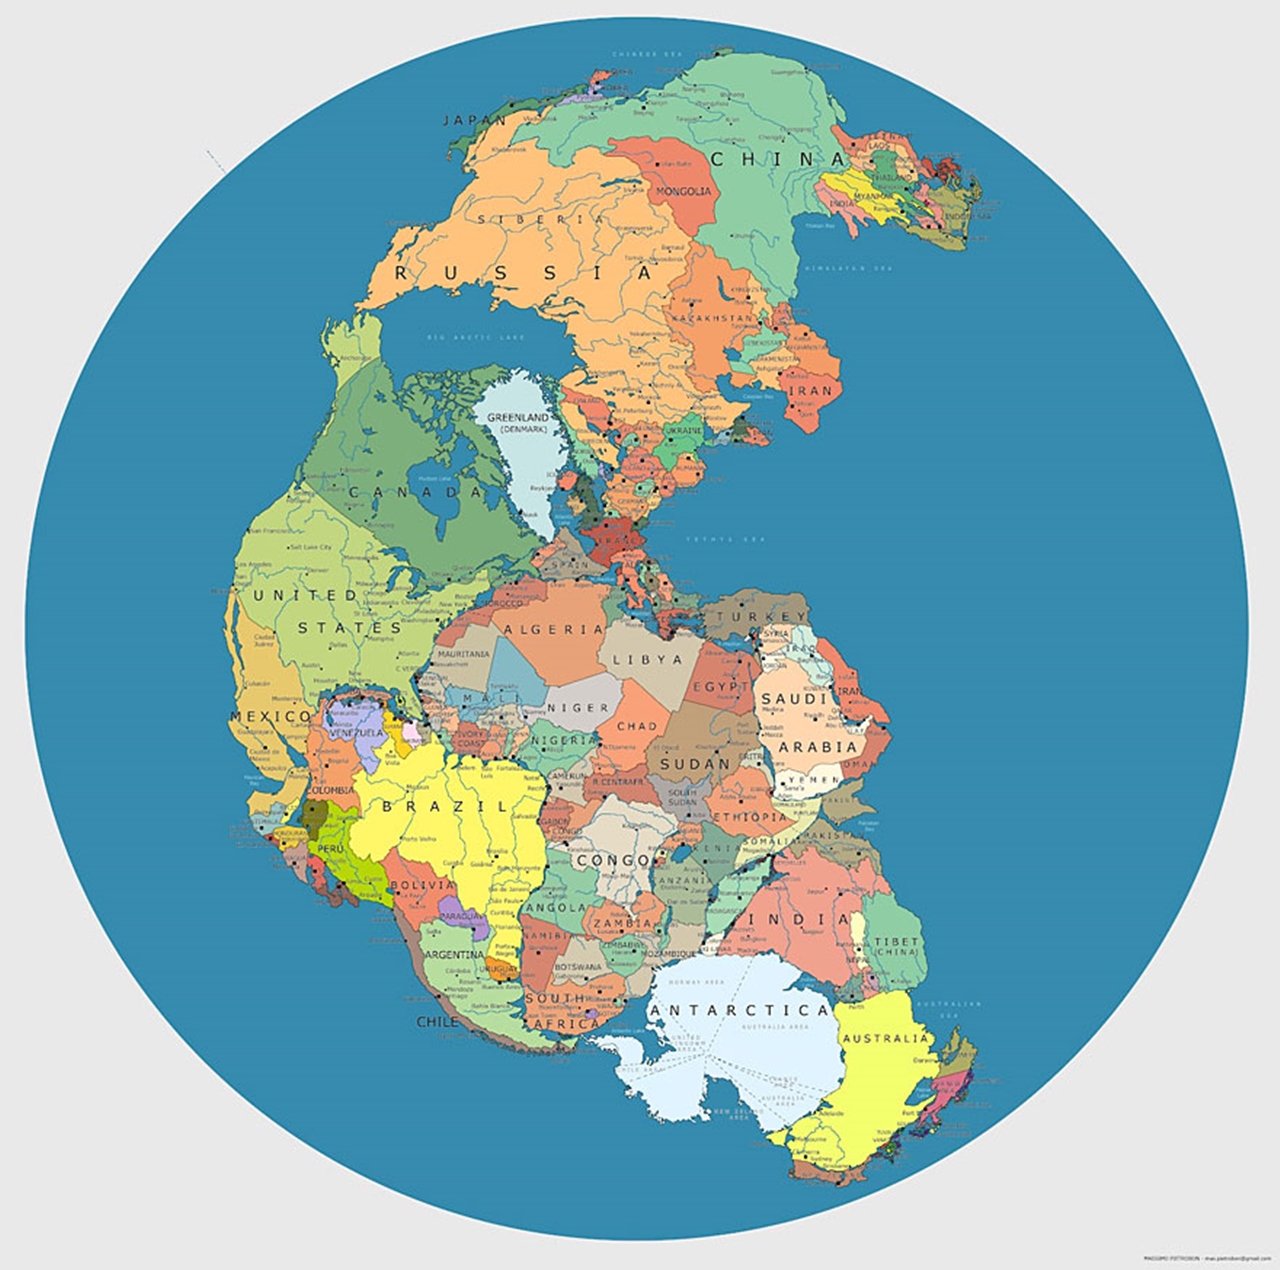
4. The appearance of the world political map in the supercontinent 200-300 million years ago
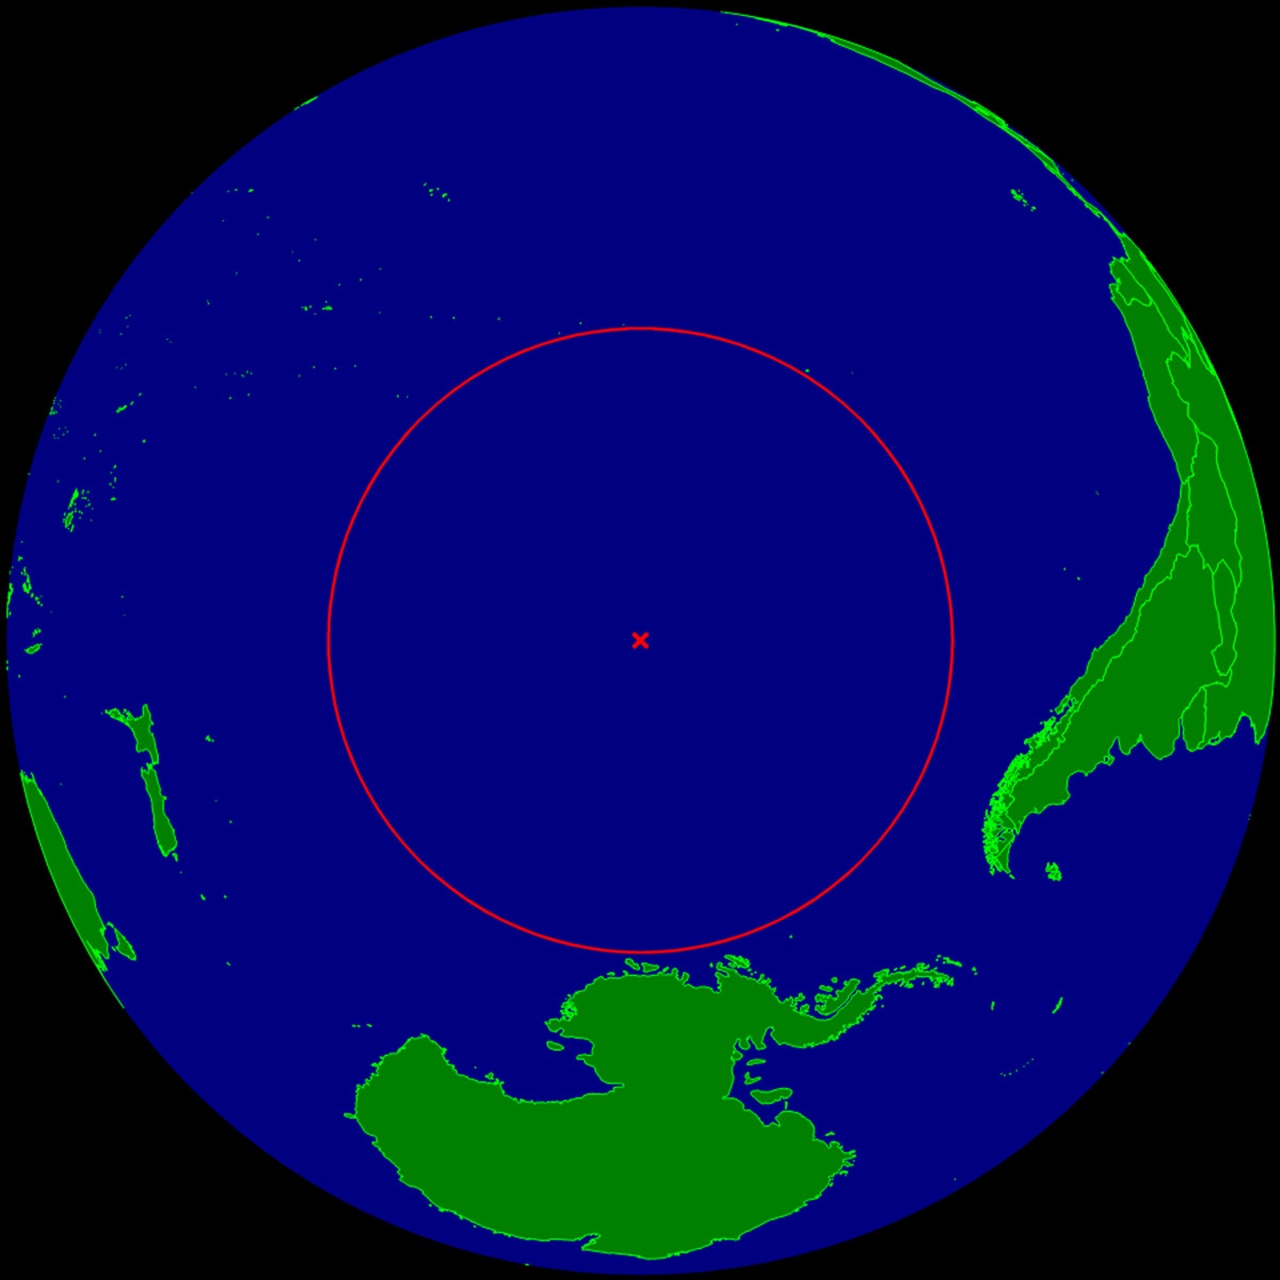
5. The point at the furthest distance from any landmass.
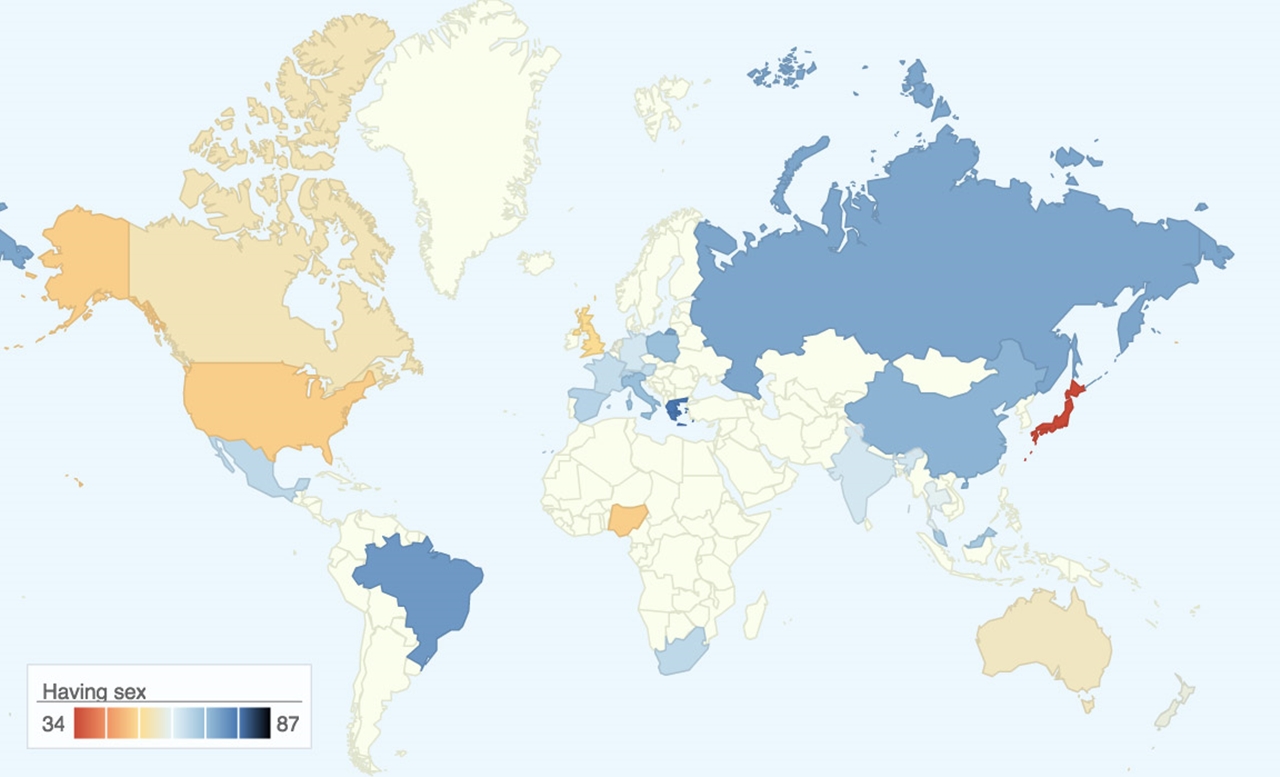
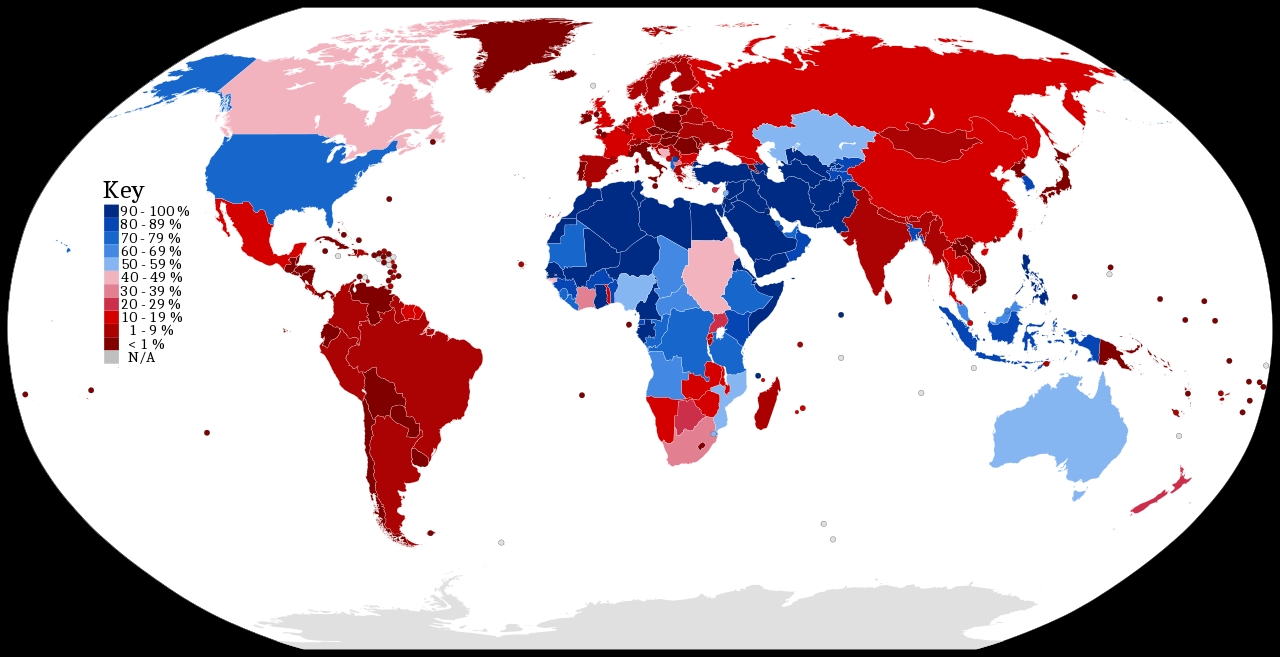
6. Map showing the percentage of people who say they have sex at least once a week.
7. Population density in Europe

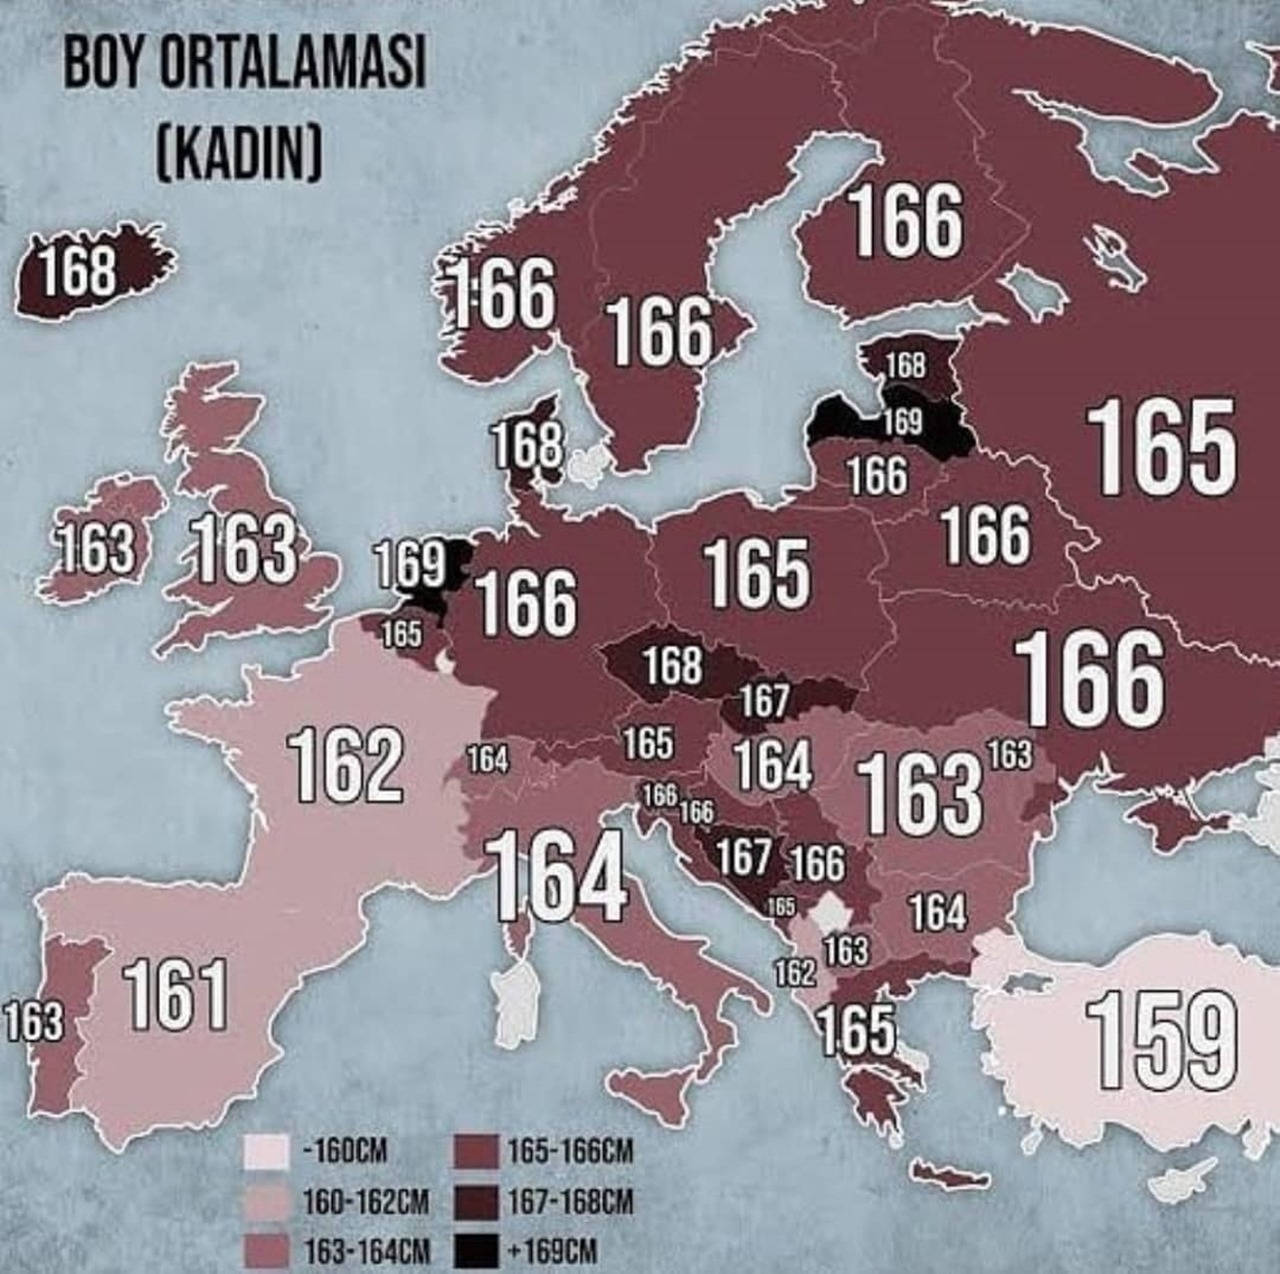
8. Average female height in European countries
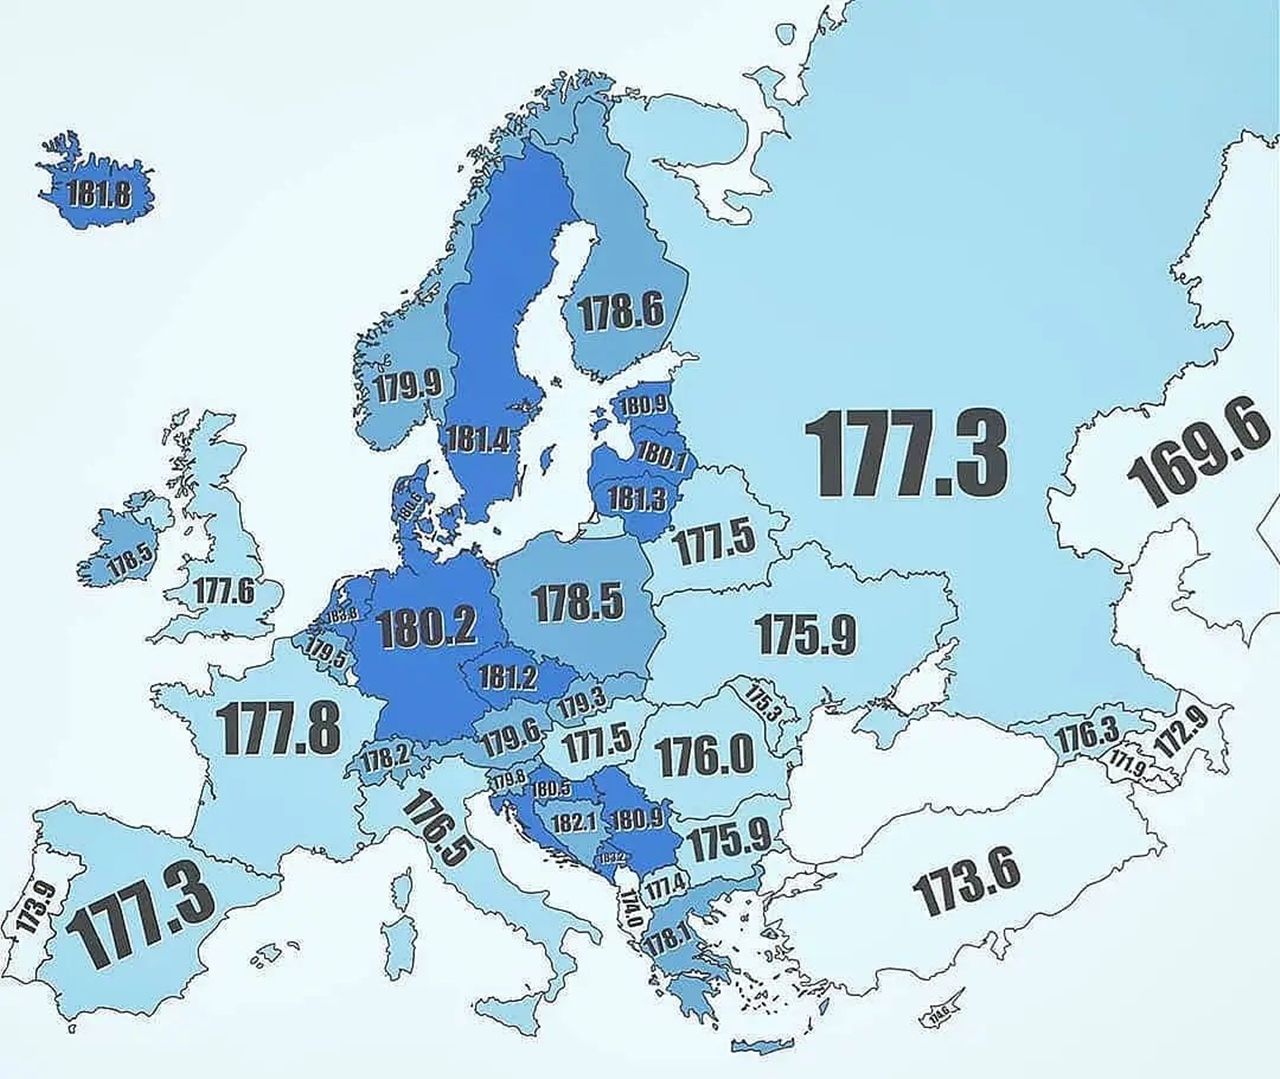
9. Average male height in European countries
10. Male circumcision rates
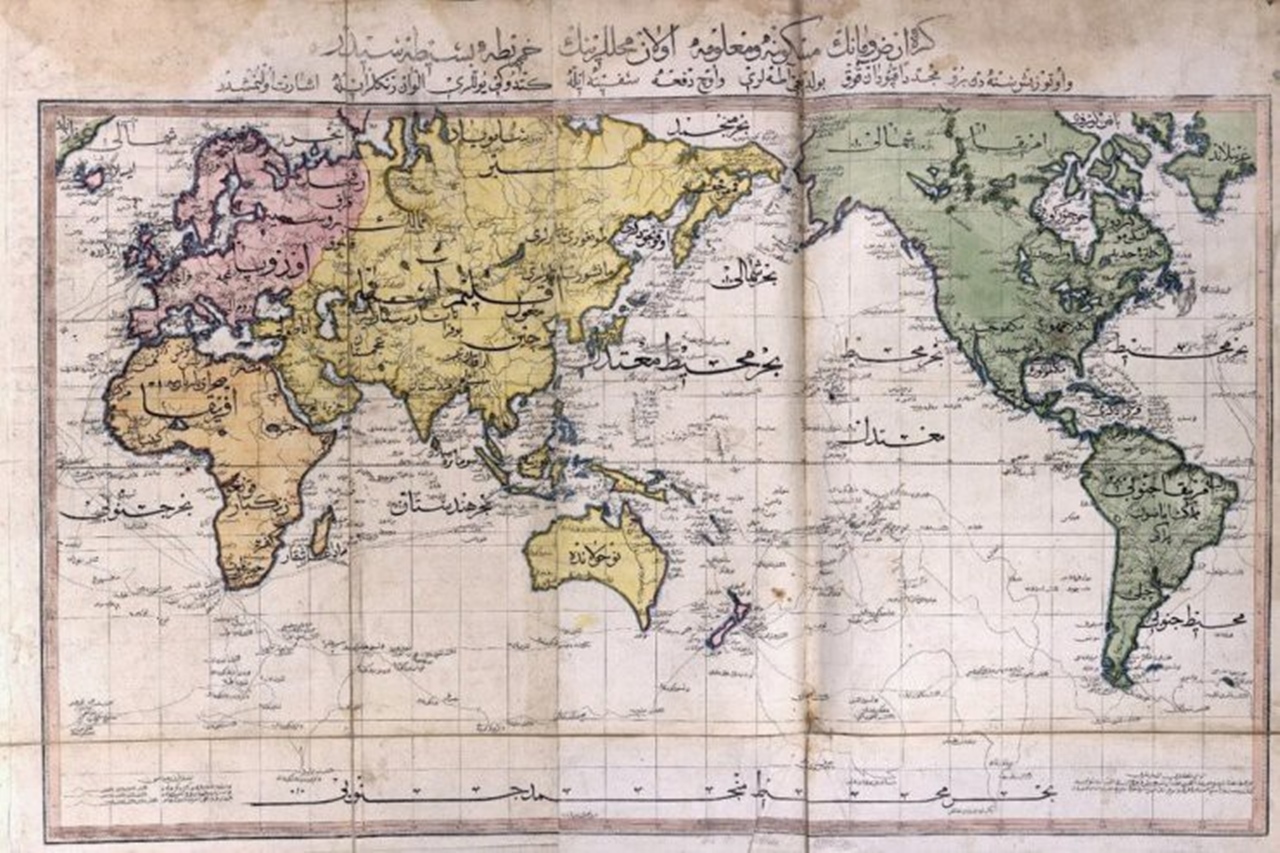
11. World map adopted by the Ottoman Empire in 1803
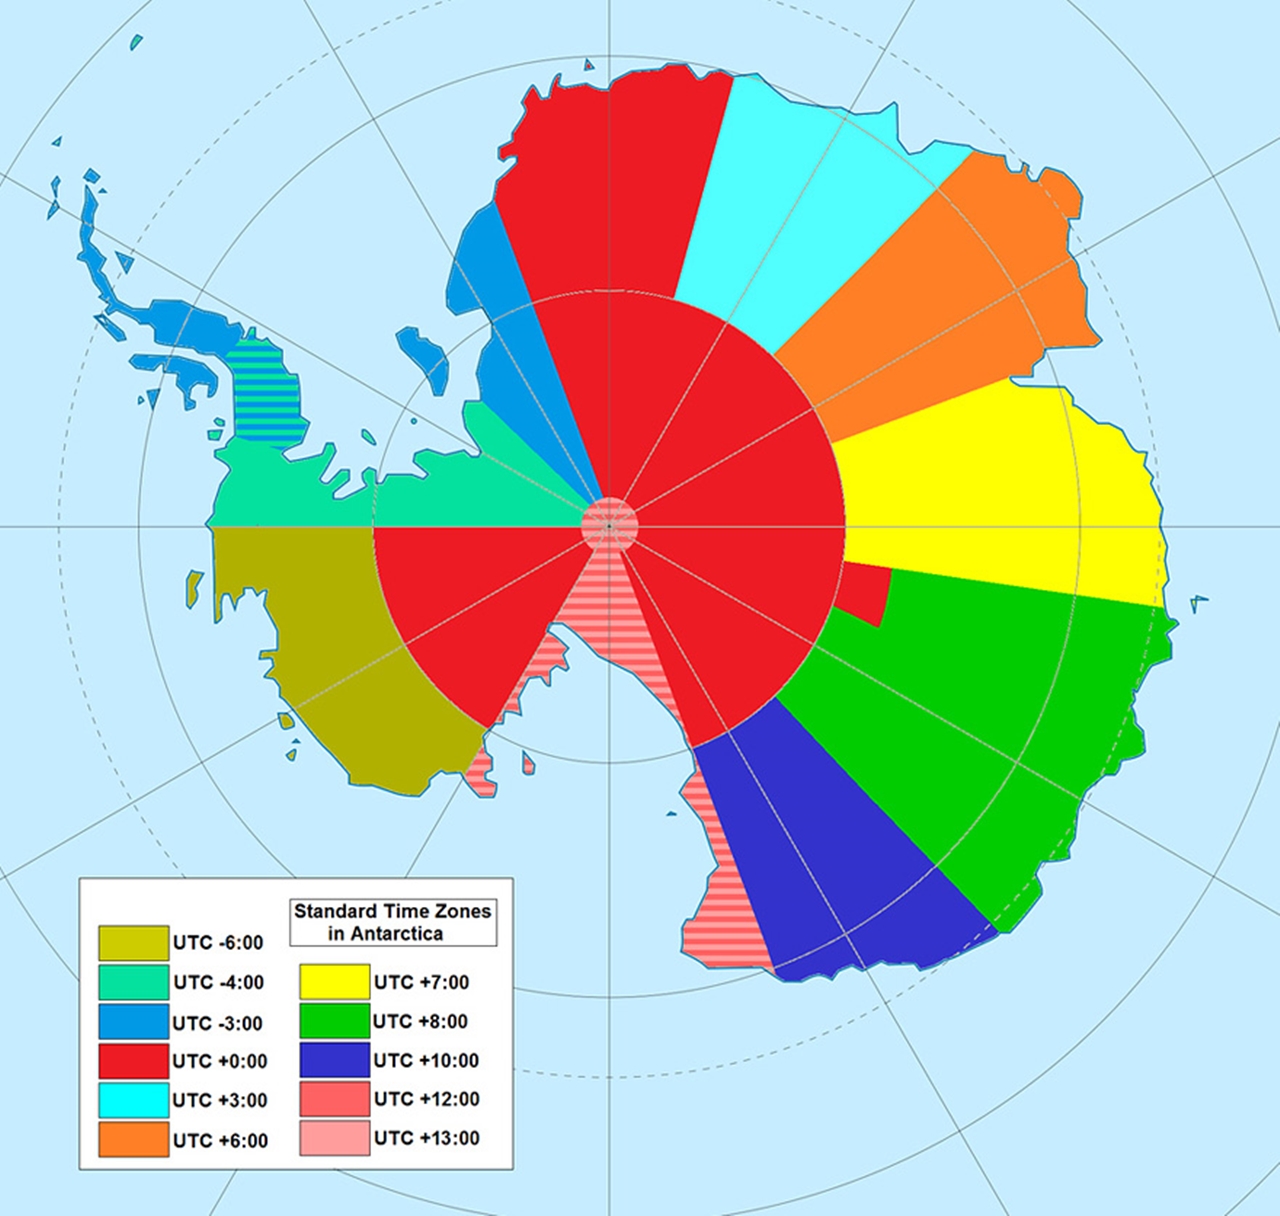
12. Time zones in Antarctica
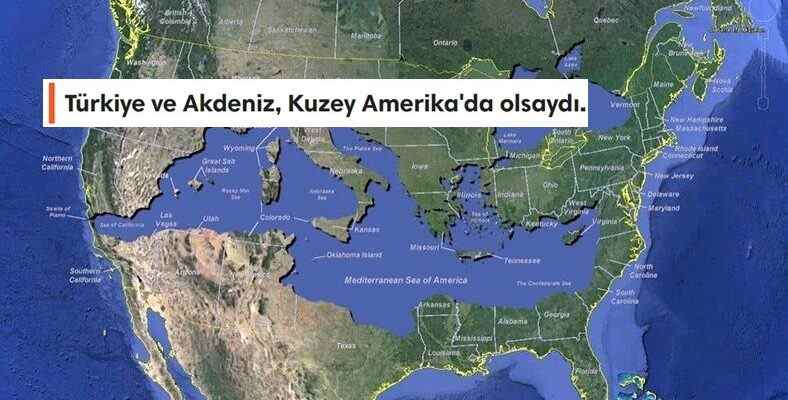
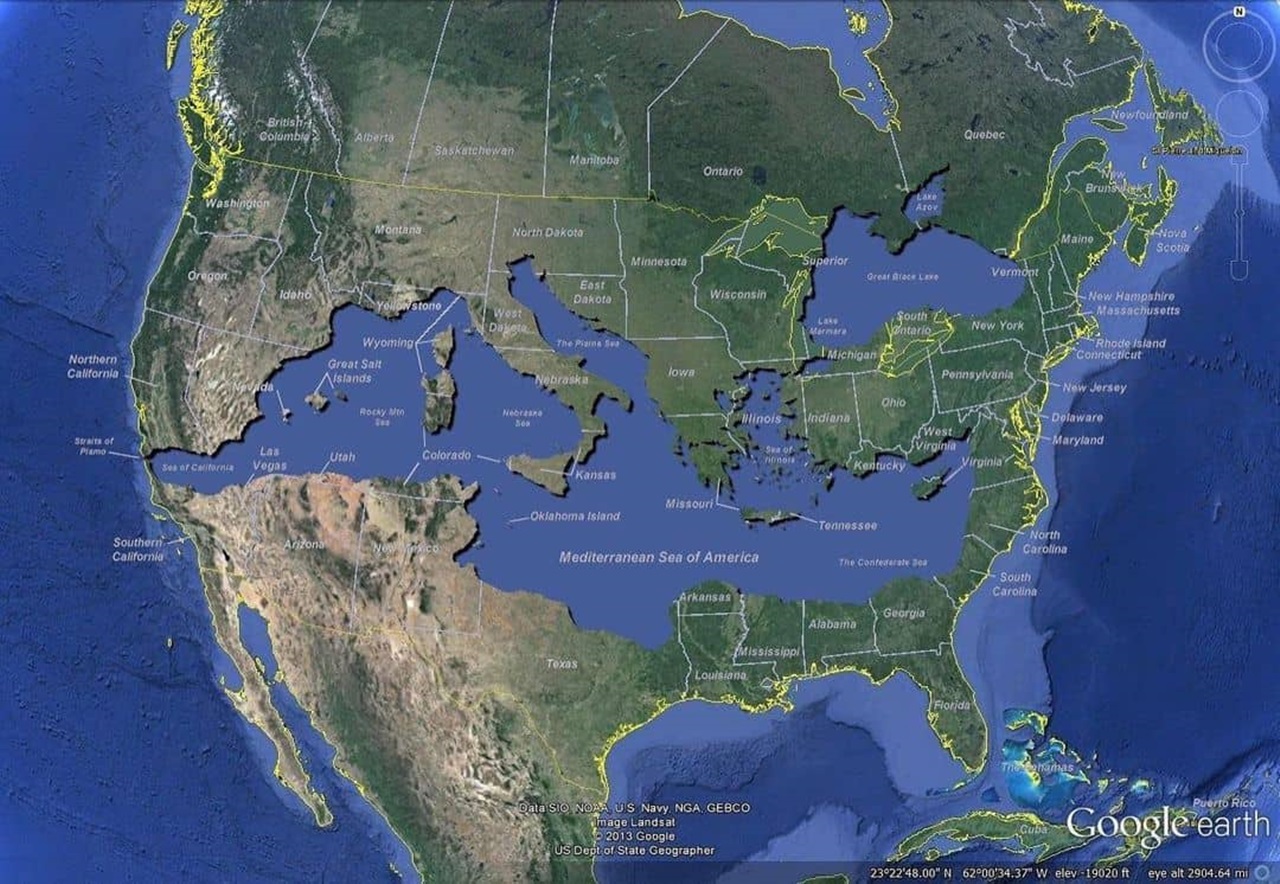
13. Mediterranean map relocated to the North American continent
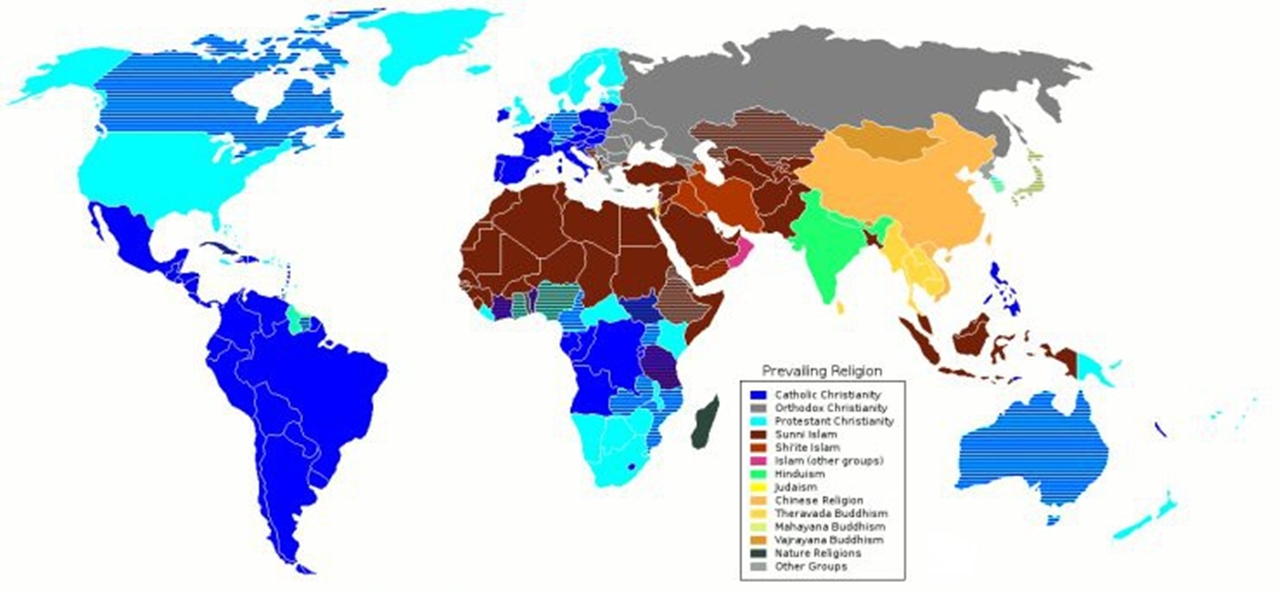
14. Distribution of religions and sects in the world
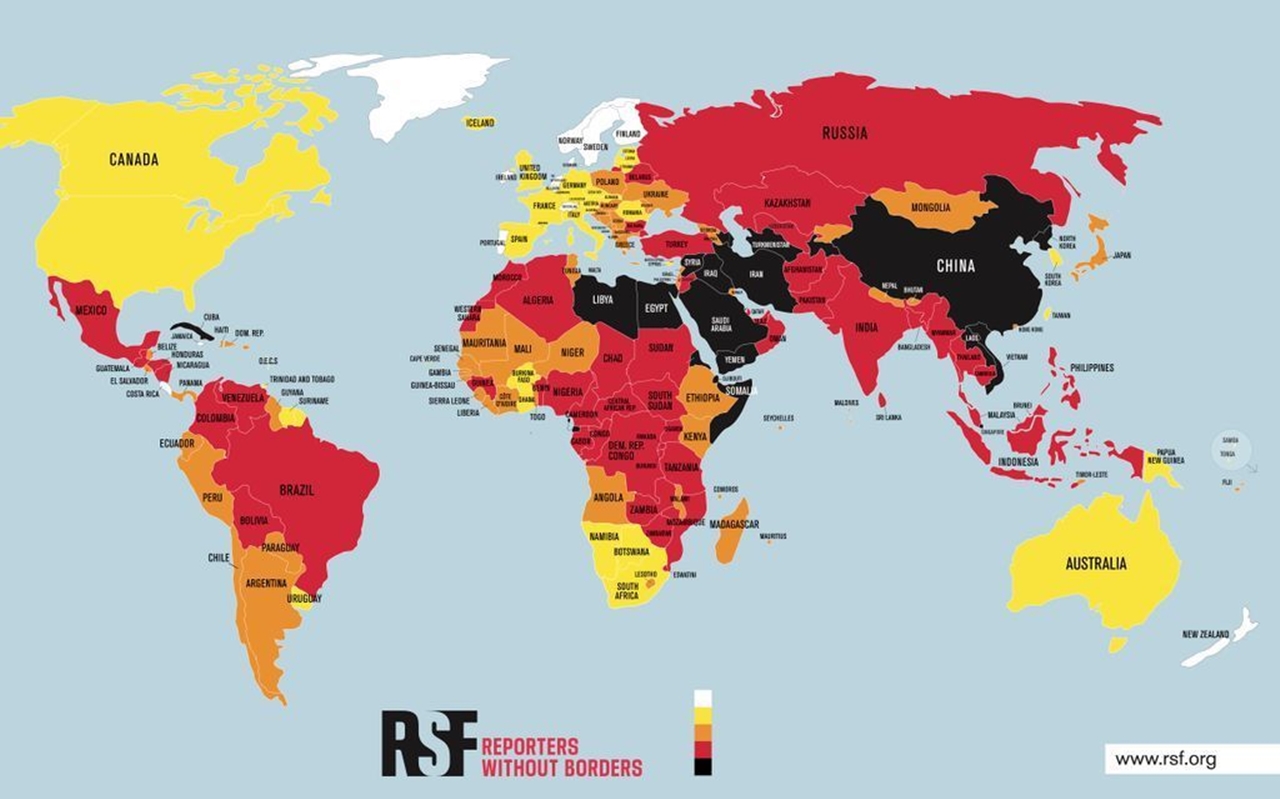
15. Press freedom map (Black and red worst, white and yellow best).
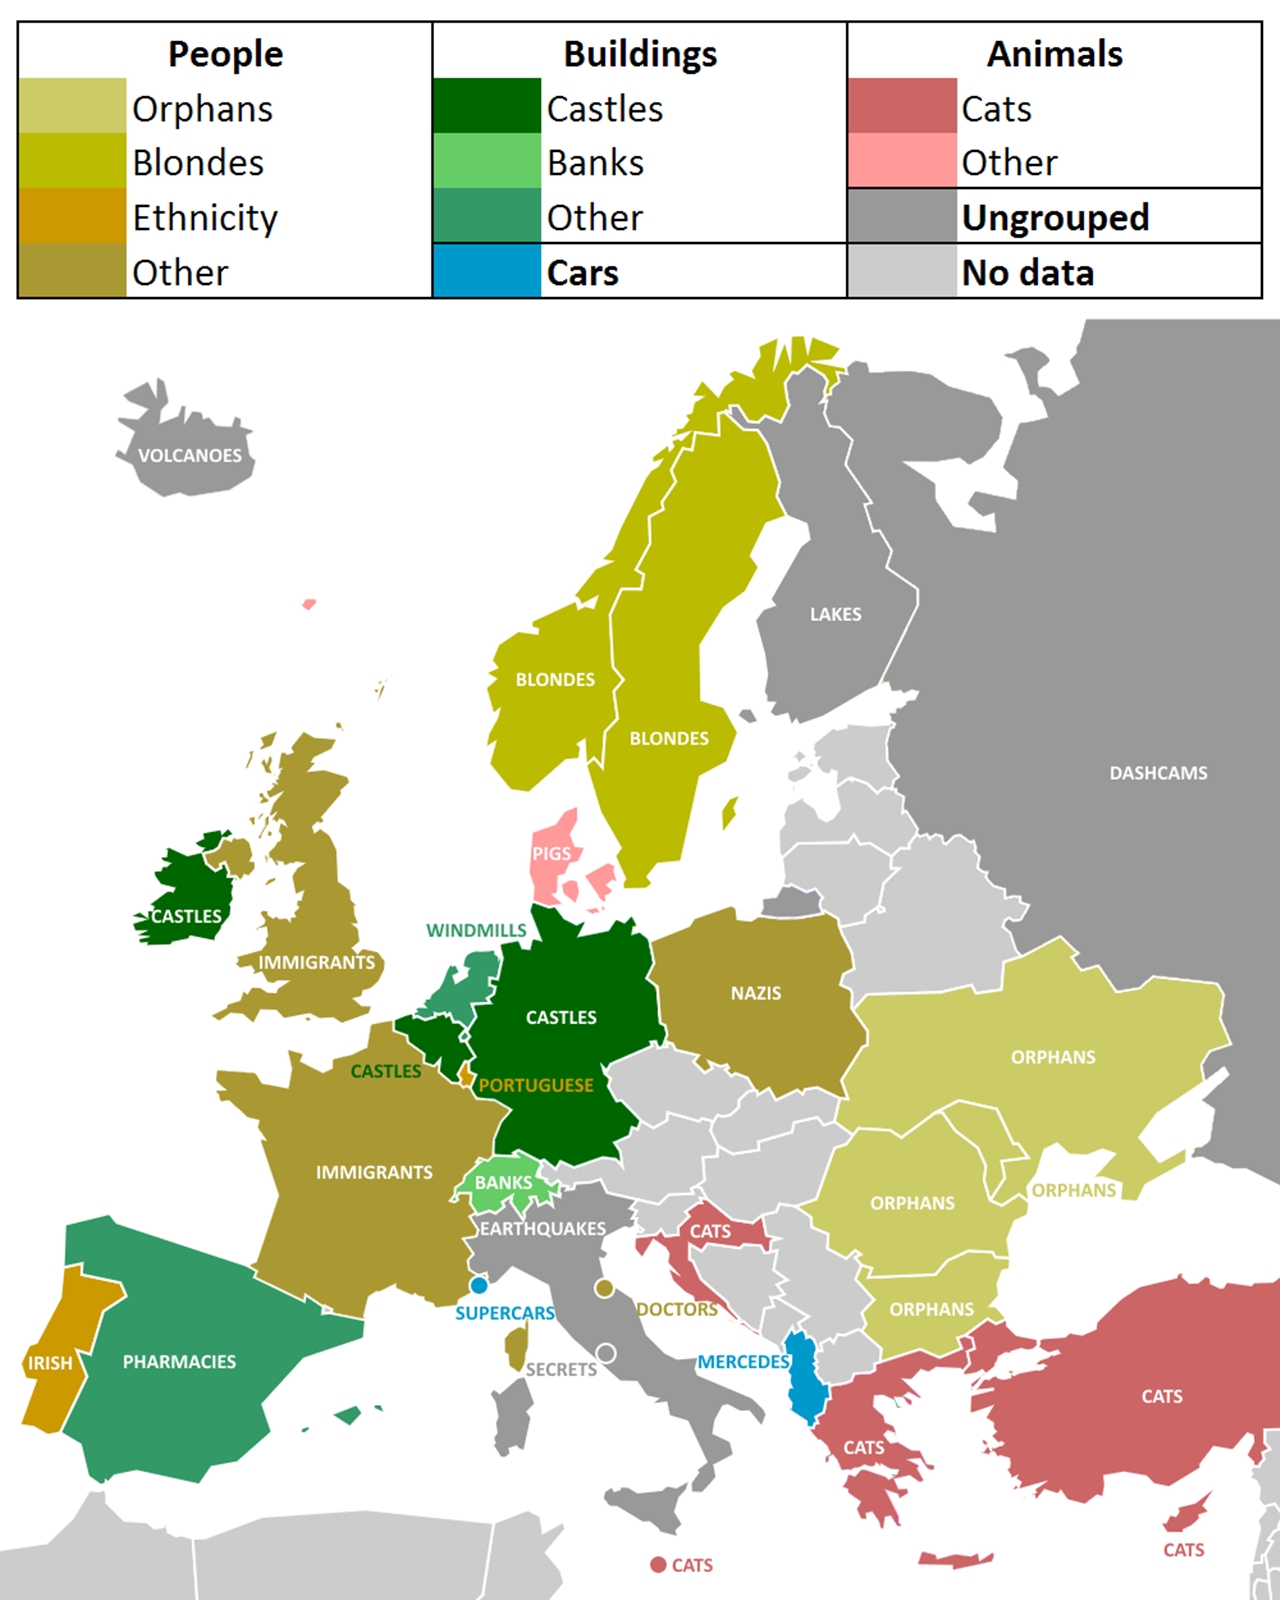
16. Google “Why are there so many x in the country in question?” Words suggested by the autocomplete feature when searched.
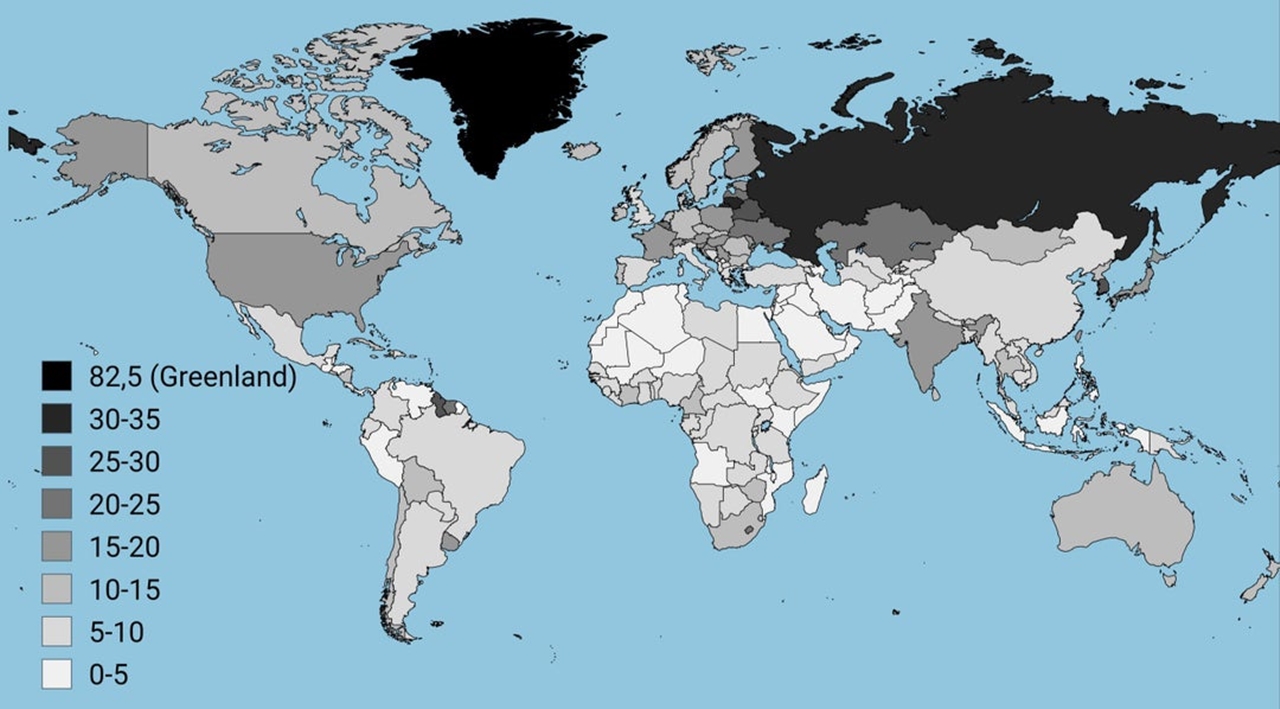
17. Suicide rate per 100,000 people
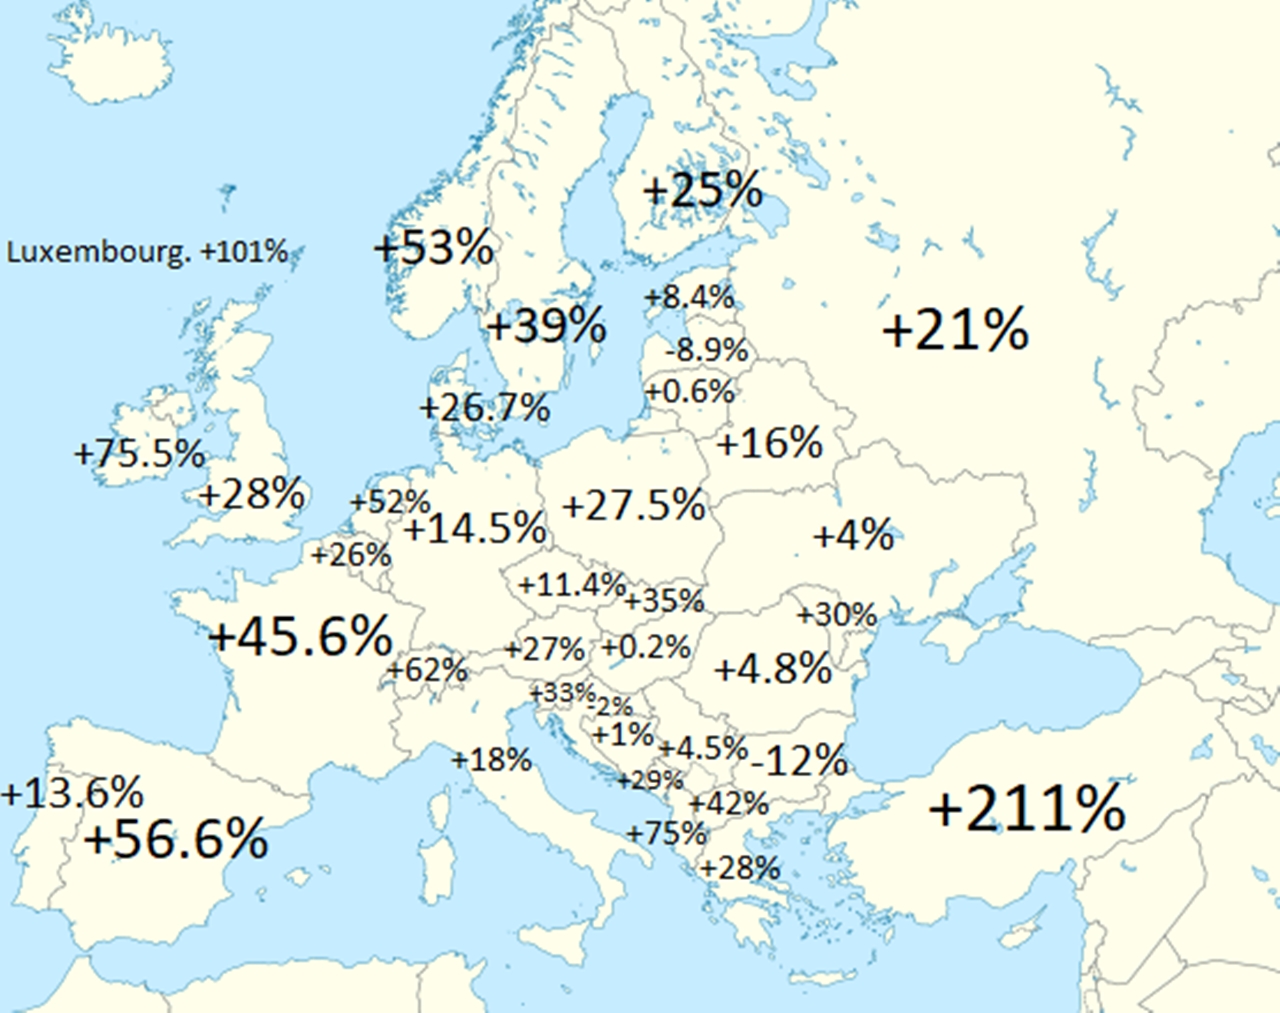
18. Percentage of population change of European countries between 1960 and 2020
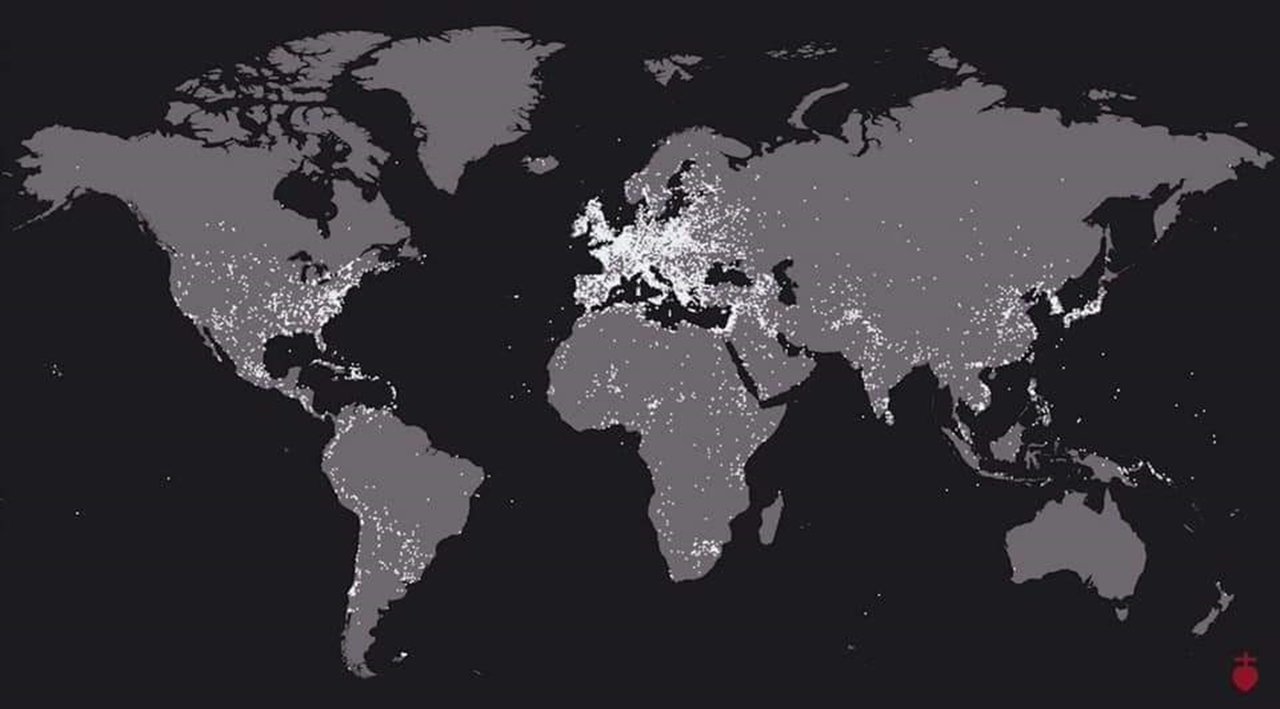
19. Where all the wars in history took place
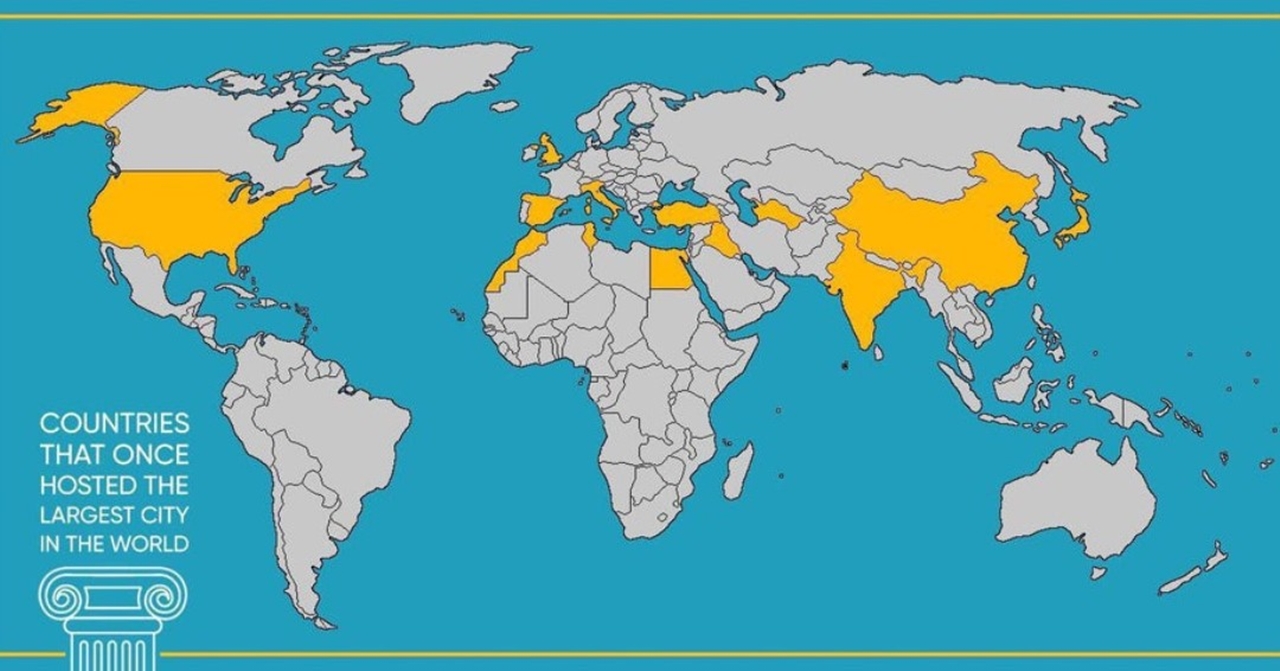
20. Countries that were once home to the world’s largest city
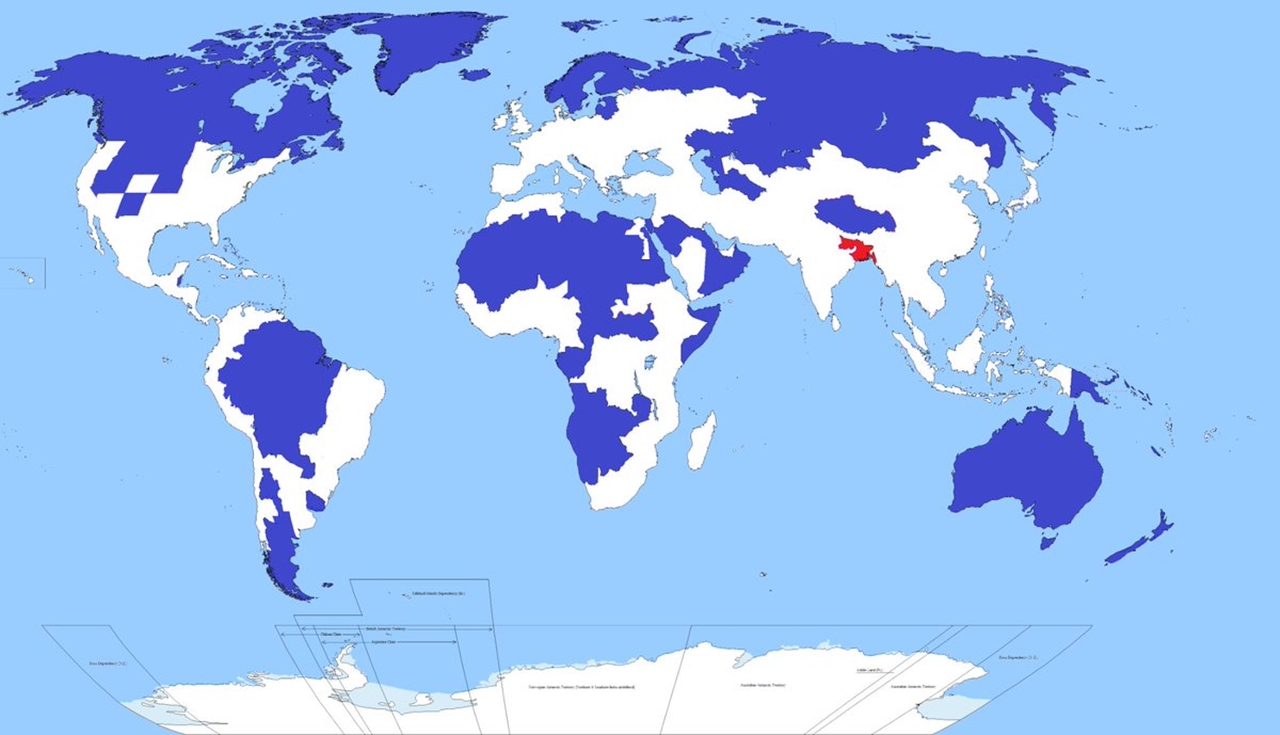
21. There are more people in the red section than in the blue section.
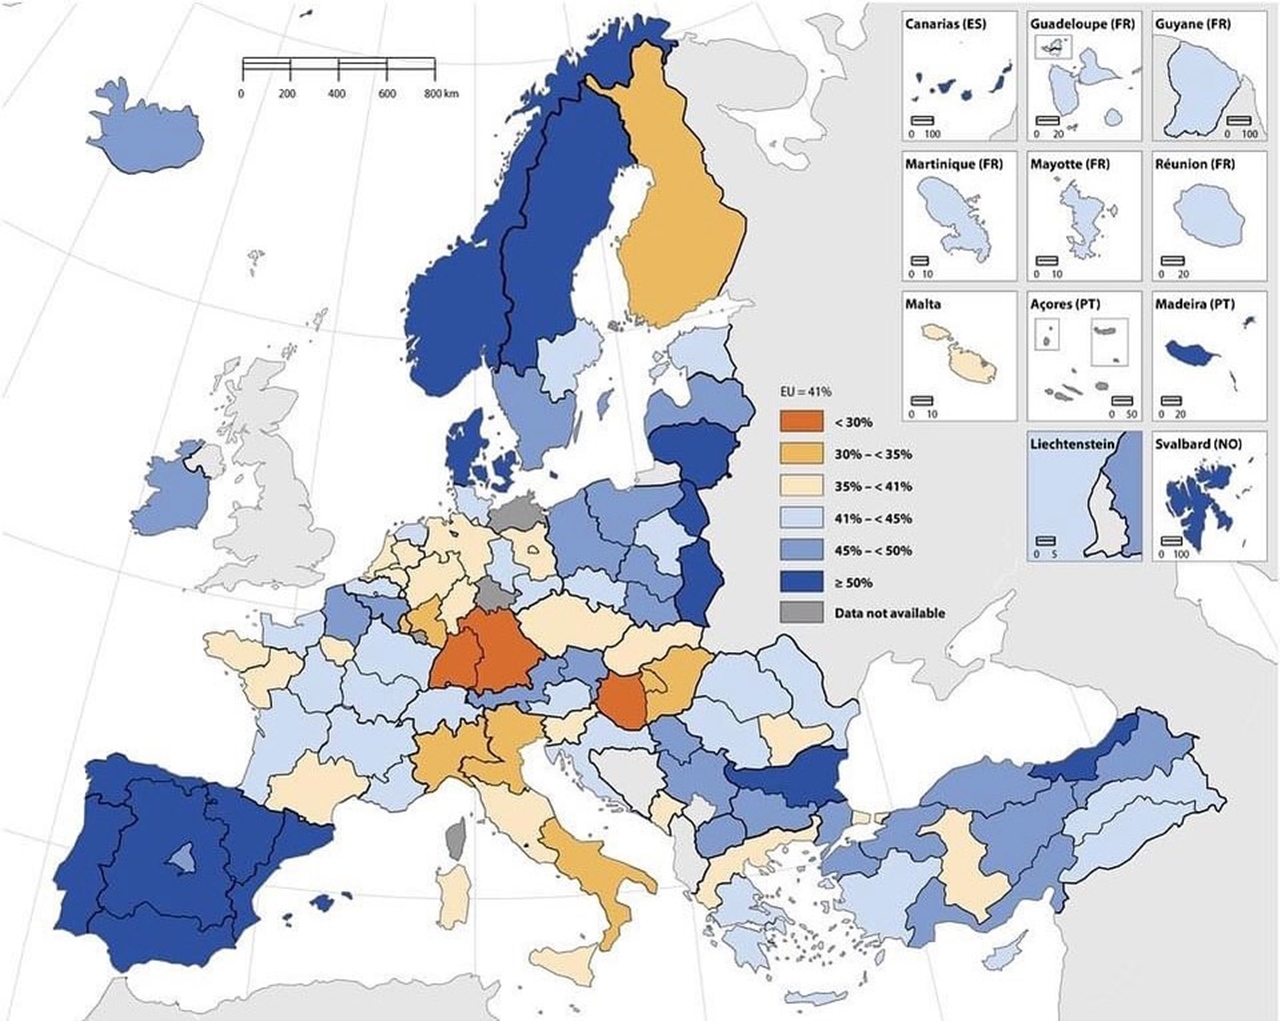
22. Ratio of female scientists and engineers by region in Europe
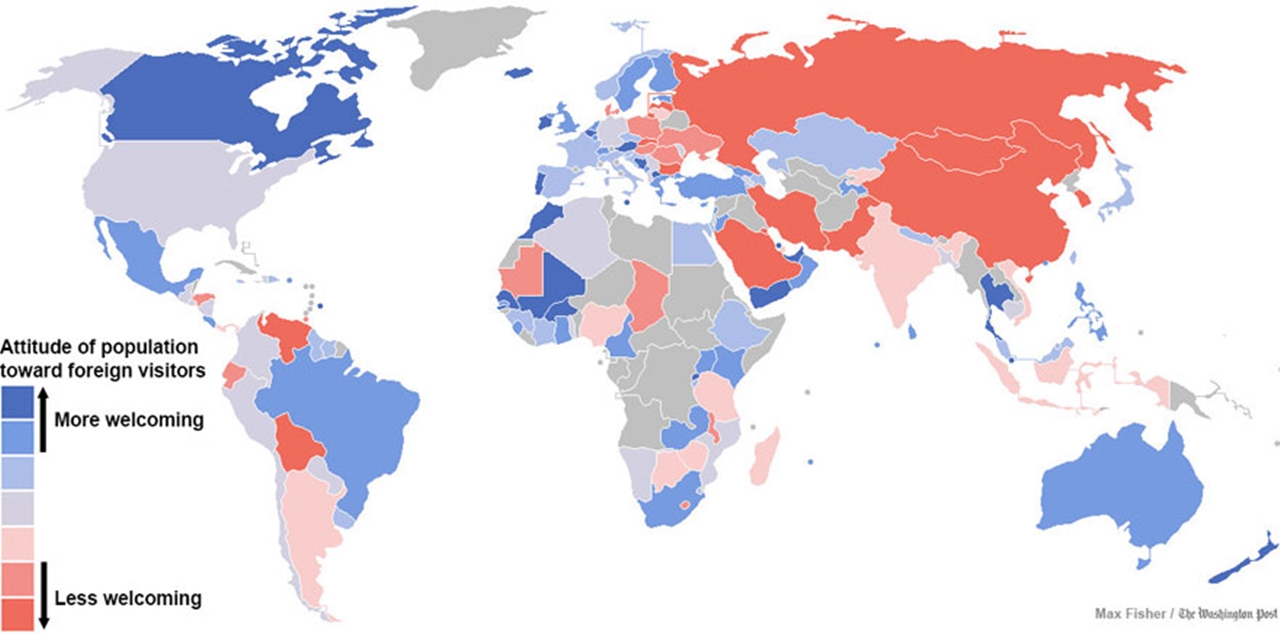
23. Map of the countries most and least welcoming to foreigners (Turkey is among the hospitable countries).
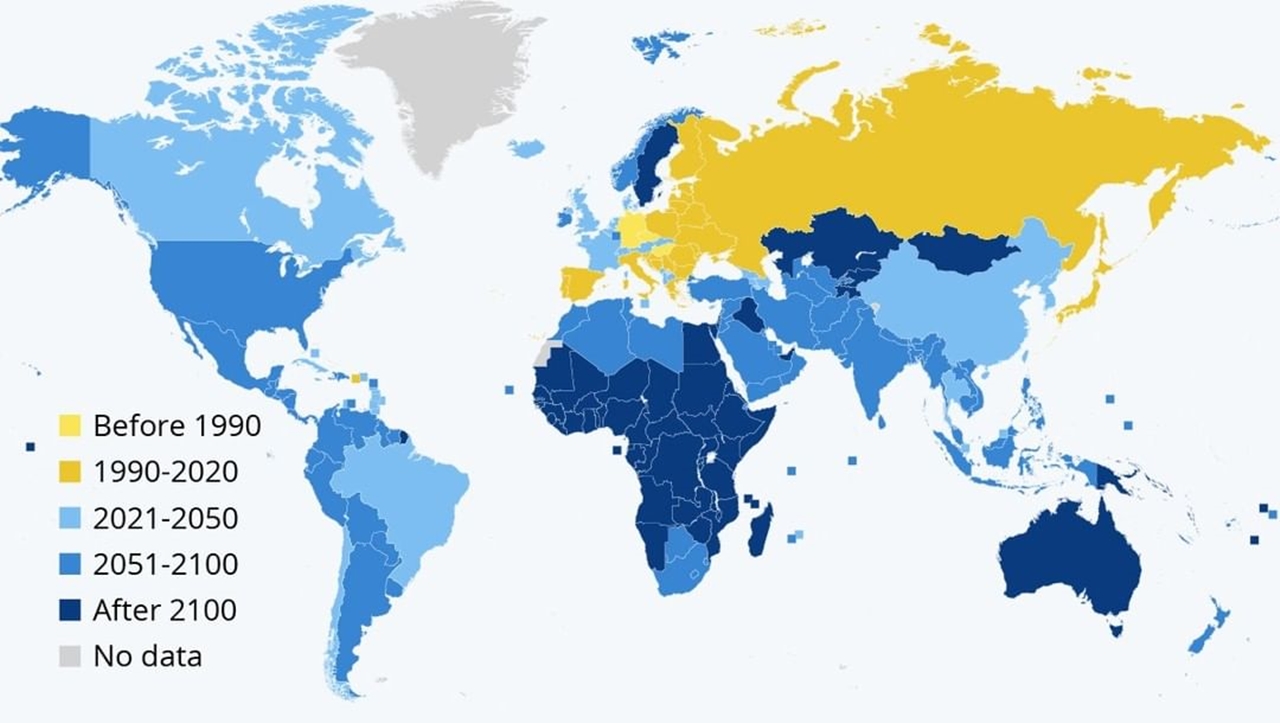
24. The years when the natural population growth of the world countries ends or will be estimated
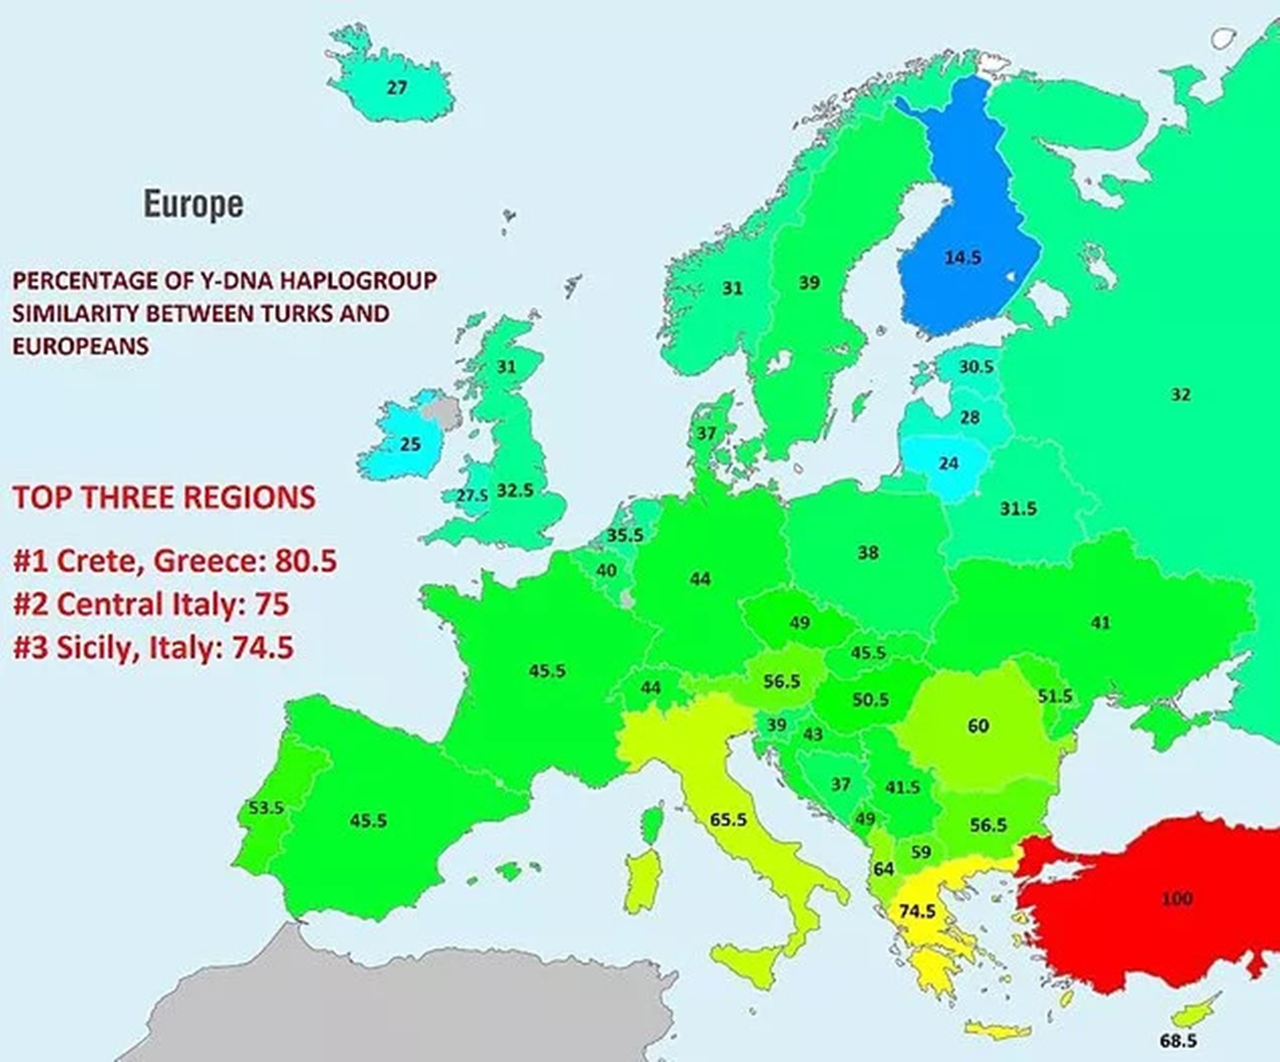
25. DNA similarity percentages between Turks and Europeans (Greeks and Italians first)
26. Spread of Turkic languages and countries where they are used
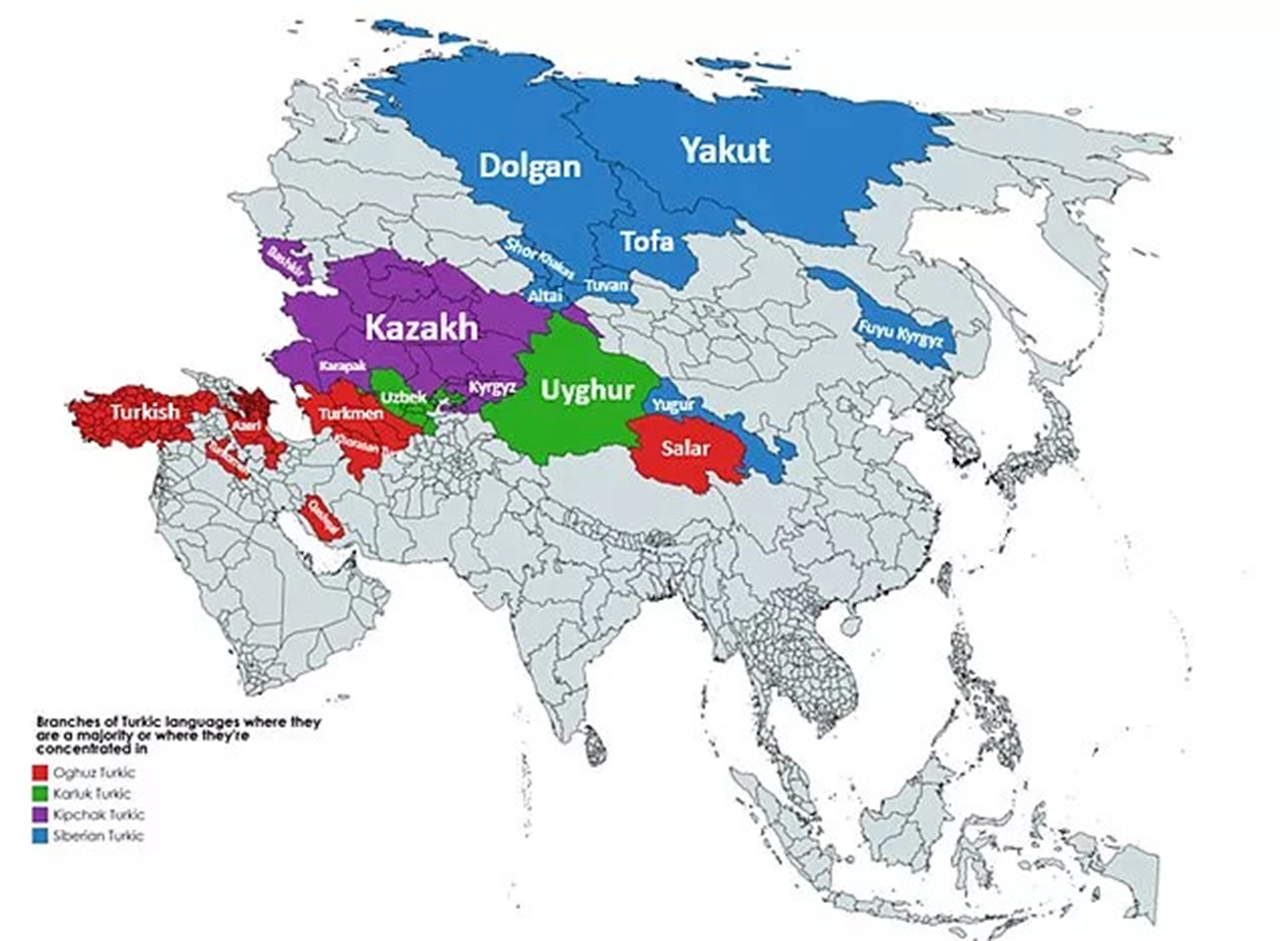
On the map, colors are used to represent different language groups:
- Red – Oghuz Turkish
- Green – Karluk Turkish
- Purple – Kipchak Turkish
- Blue – Siberian Turkish
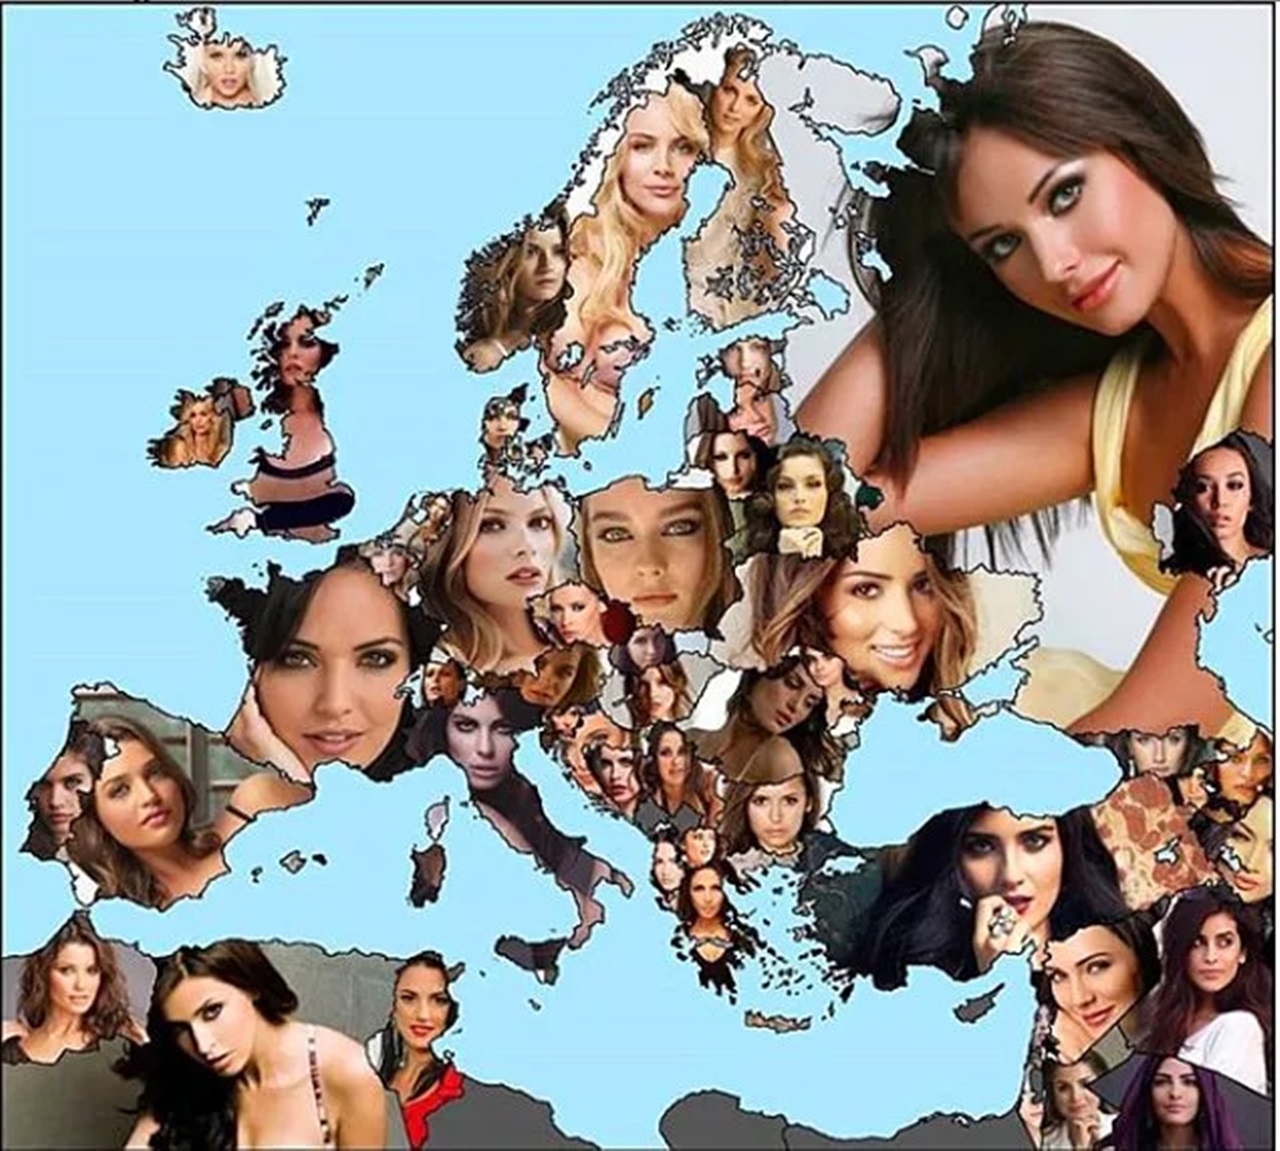
BONUS: Featured beautiful women of countries
RELATED NEWS
How Many of These Middle School World Geography Questions Can You Get Right? It’s Near Impossible to Know All!
RELATED NEWS
We Compared Turkey’s Size with Other Countries: Surprising Results Revealed (in terms of surface area)
RELATED NEWS