
Polkadot, one of the altcoins that stand out with the rise in the crypto money market, has gained approximately 48% since July 26.
When we look at the technical data, it can be seen that the price has been moving horizontally for about 2 months, between the bottom point of 6 dollars and the peak of about $ 8.84 since June 13, with the last drop.
With the latest movement, the price continues to move above the 8,80/8.70 level, which is the 4-hour + daily resistance zone, and it is seen that the buyers are keeping the price above this level.
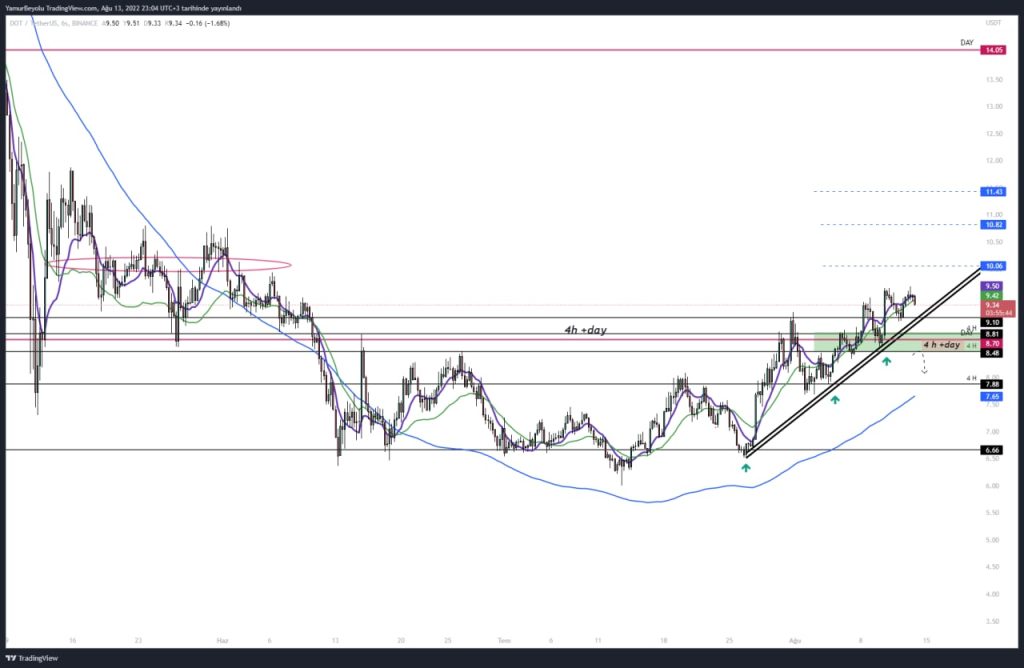
The resistance levels that can be followed by holding this level by the buyers and closing the region daily will be $10.06 / $10.82 / $11.43, and the most important one will be the daily resistance level of 14.05.
In the worst scenario, if it closes below about $8.46, which is stated as 4h+day, pullbacks to lower support levels can be seen. If the rising trend structure that has been maintained since July 26 is not broken, the upper resistance levels can be followed. The nearest support level is $9.10. (Price Instant: $ 9.34)
When we look at the data of another DEMA (moving averages) indicator, we can see that there is still an upward transition between the 21 and 50-day demas and the effect of buyers on this level.
Resistance levels: $10.06 10.82 11.43 and $14.05
Support levels: 8.46 8.68 8.84 and 9.10 dollars
For exclusive news, analytics and on-chain data Telegram our group, twitter our account and YouTube Follow our channel now! Moreover Android and iOS Start live price tracking right now by downloading our apps!