
The gold price continues its corrective decline from a ten-day high of $1,993 hit on Friday. The yellow metal is looking for clear directional momentum at the start of a new week on Monday. In the absence of high-level US economic data and Fed statements, risk sentiment is likely to remain the key driver behind gold price action.
Fed’s interest rate stance and FOMC Minutes
The gold market is reacting to the broader economic landscape, particularly the Fed’s rate hike campaign. Recent economic data indicating that the US employment market is slowing down and inflation is lower than expected has led to speculation that the Fed may pause interest rate increases. Meanwhile, the dollar fell to its lowest level in the last two months. This supports this view and market expectations are shifting towards possible interest rate cuts. The CME FedWatch tool puts a 30% chance of rate cuts starting as early as March.
cryptokoin.comAs you follow from , the minutes of the Fed’s last meeting are eagerly awaited to be announced in the coming days. Market players will look for clues about the Fed’s decision-making process from these minutes. Expectations are that the minutes will potentially signal a shift towards more dovish policies. This shift, often referred to as the “Fed pivot,” could support lower U.S. Treasury yields and a weaker dollar. It is possible that this will support the gold price and other risk assets.
Economic indicators and investor focus
Despite these developments, there is a significant divergence between the gold price and real returns. Economic data will likely need to weaken significantly for gold to surpass the $2,000 level. This is evident from recent trends in labor market and consumer inflation reports, which have revived hopes that the Fed will ease monetary conditions sooner than expected.
Investors are now focused on the Fed minutes for more clarity on interest rate paths. Meanwhile, assets in the SPDR Gold Trust, the largest gold-backed ETF, continue to rise. Accordingly, assets increased by 1.49% to 883.43 tons. This shows that investors’ interest in gold continues in changing economic conditions.

Short term predictions for gold price
Market analyst James Hyerczyk evaluates gold’s short-term outlook and then its technical picture. In the short term, gold prices are likely to remain sensitive to changes in US monetary policy and economic indicators. Given the recent dovish signals from the Fed and downward pressure on the US dollar, there is potential for a modest upside in gold prices.
However, the size of this increase is likely to be limited. Because the market is diverging between the gold price and real returns. If the upcoming FOMC minutes confirm a shift towards a more accommodative monetary policy, we could see further support for the gold price. Overall, the short-term outlook for gold looks cautiously optimistic, with the possibility of gradual gains.
Gold technical analysis: The upward trend is strong in the medium and long term
In the gold market, the current daily price of $1,979.81 is trading near the minor resistance level at $1,987.00. This indicates a potential difficulty in exceeding the threshold. This price is above the 200-day and 50-day moving averages of $1,937.71 and $1,928.63, respectively. This points to a general upward trend in the medium and long term.
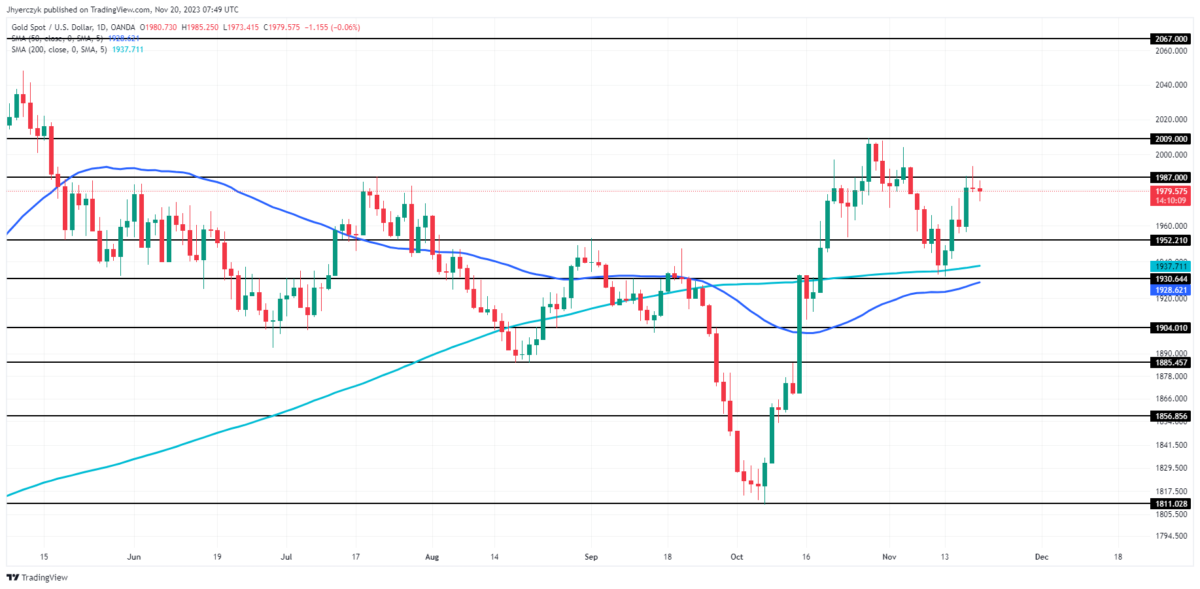
However, the proximity to the major resistance at $2,009.00 is likely to limit the upside. However, the $1,952.21 (minor) and $1,930.64 (major) support levels provide downside protection. This shows that the price is currently in a consolidation phase within these limits. The current gold price remains in a delicate balance near critical resistance levels. Therefore, overall market sentiment is leaning towards the bullish. However, you still need to be careful.
Gold price technical analysis
Market analyst Dhwani Mehta explains what he sees in the technical picture as follows. The gold price suffered a sharp pullback from multi-day highs on Friday. Thus, it is flirting with the 21-day Simple Moving Average (SMA) at $1,975. It also challenges bearish commitments. Failure to maintain this level on a daily closing basis could trigger a new downtrend towards the static support in the $1,955-$1,950 region. Additional declines are likely to challenge the ascending 200-day SMA at $1,938. Before this, it is possible that the November 14 low of $1,944 may come to the rescue of gold buyers.

Meanwhile, the 14-day Relative Strength Index (RSI) is declining. But it’s still above the midline. This suggests that any decline will likely be temporary. The immediate upside barrier is seen at the downtrend line resistance at $1,991, where Friday’s high of $1,993 will be retested. Acceptance above the latter would trigger a fresh advance for the gold price towards the $2,000 mark.
To be informed about the latest developments, follow us twitter‘in, Facebookin and InstagramFollow on and Telegram And YouTube Join our channel!