
In many of our previous analyzes ma200 per weekWe emphasized. The current situation of this price average, which is among the most important indicators for investors waiting for the bottom of the bear market in Bitcoin, is quite promising.
bitcoinof about 4-year average price This data, which allows us to see, is of great importance in terms of marking the bottom of the bear market in the past years.
While everyone was afraid, we have previously stated that there are buying signals in Bitcoin. As we mentioned in this news, Bitcoin has re-exited to the safe zone.
Related Content: 5 Indicators Give Buy Signals As Bitcoin Drops Below $20,000!
We see that the last 3-week close is above ma200. We tested this level in the first week of August and found that it was maintained. Last week, we saw up to $25,000 above this level.
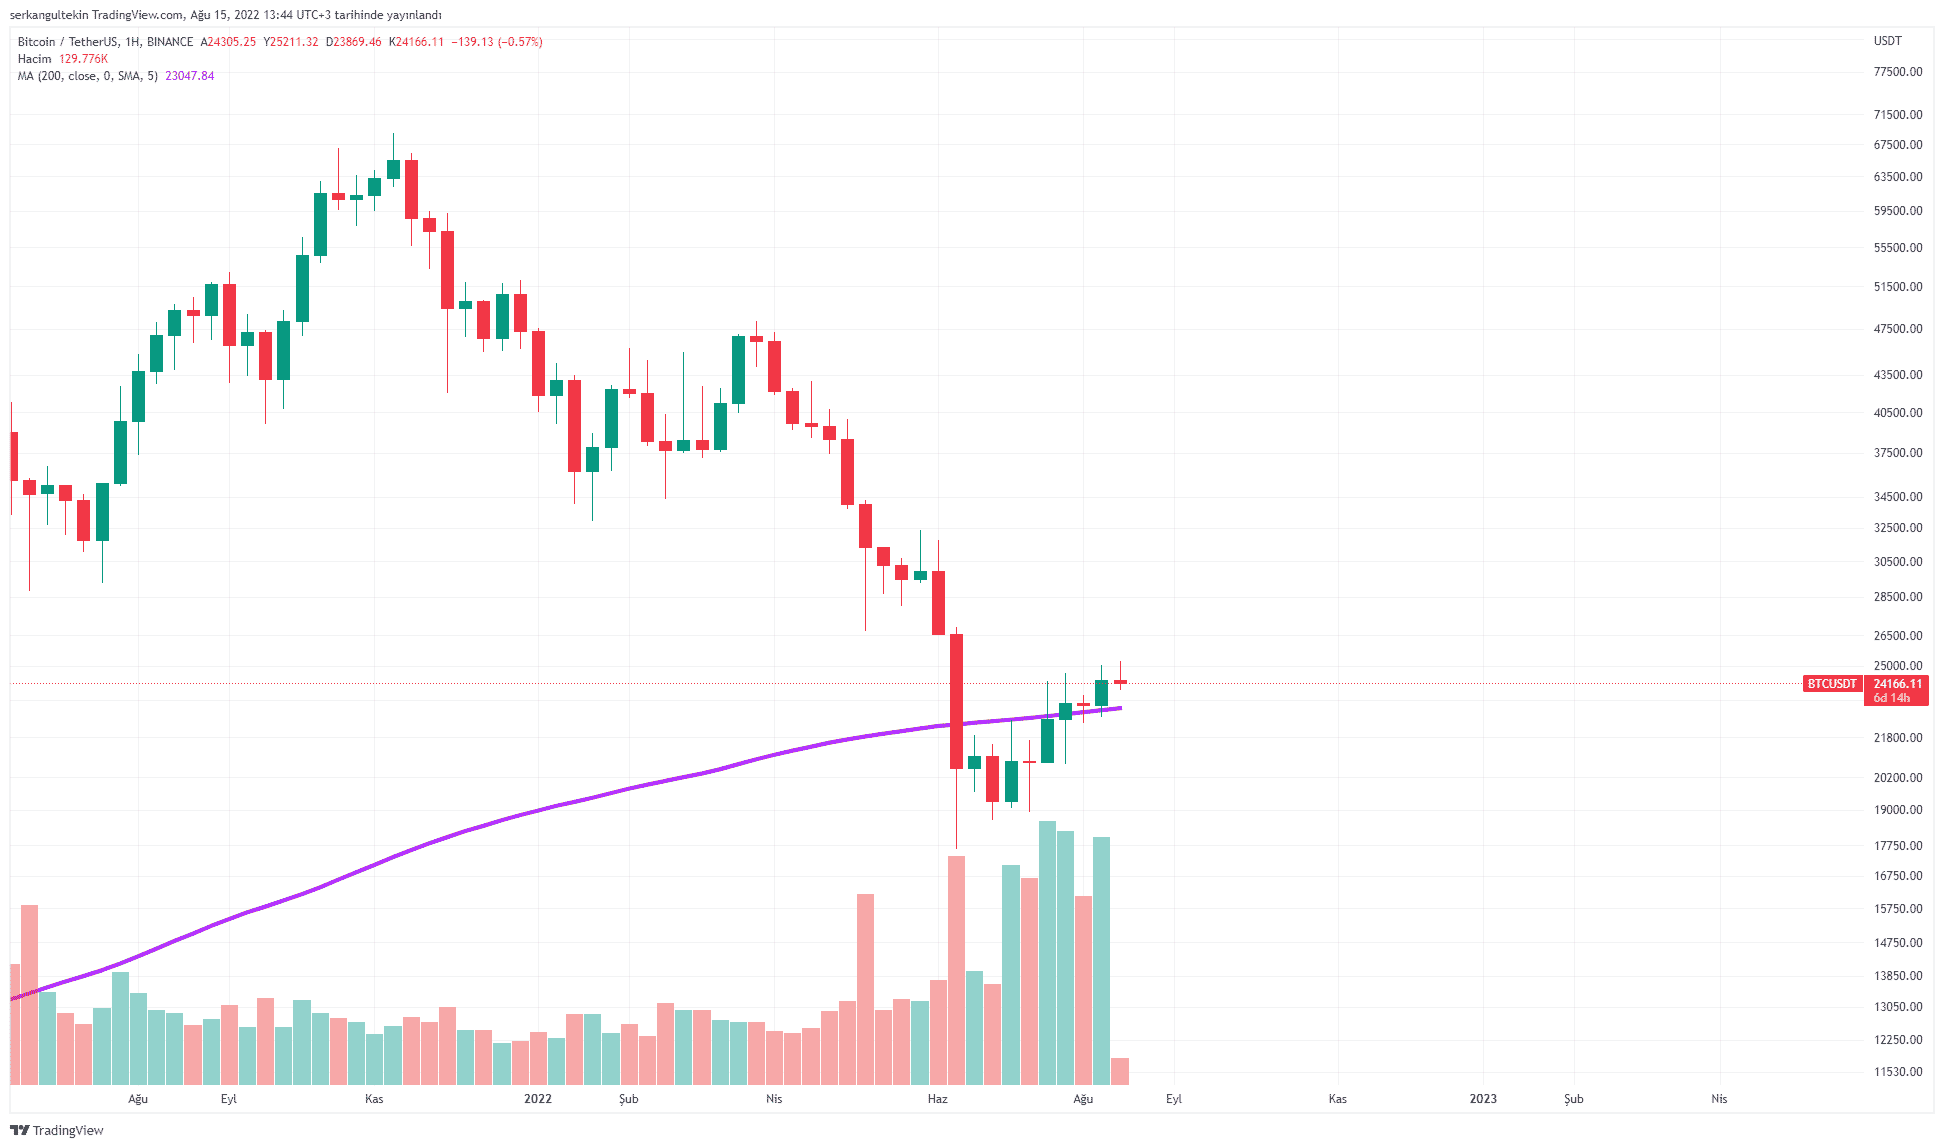
From now on, our main support point will be $23047 (weekly ma200). As long as the price stays above this level, we believe that the market should be viewed positively.
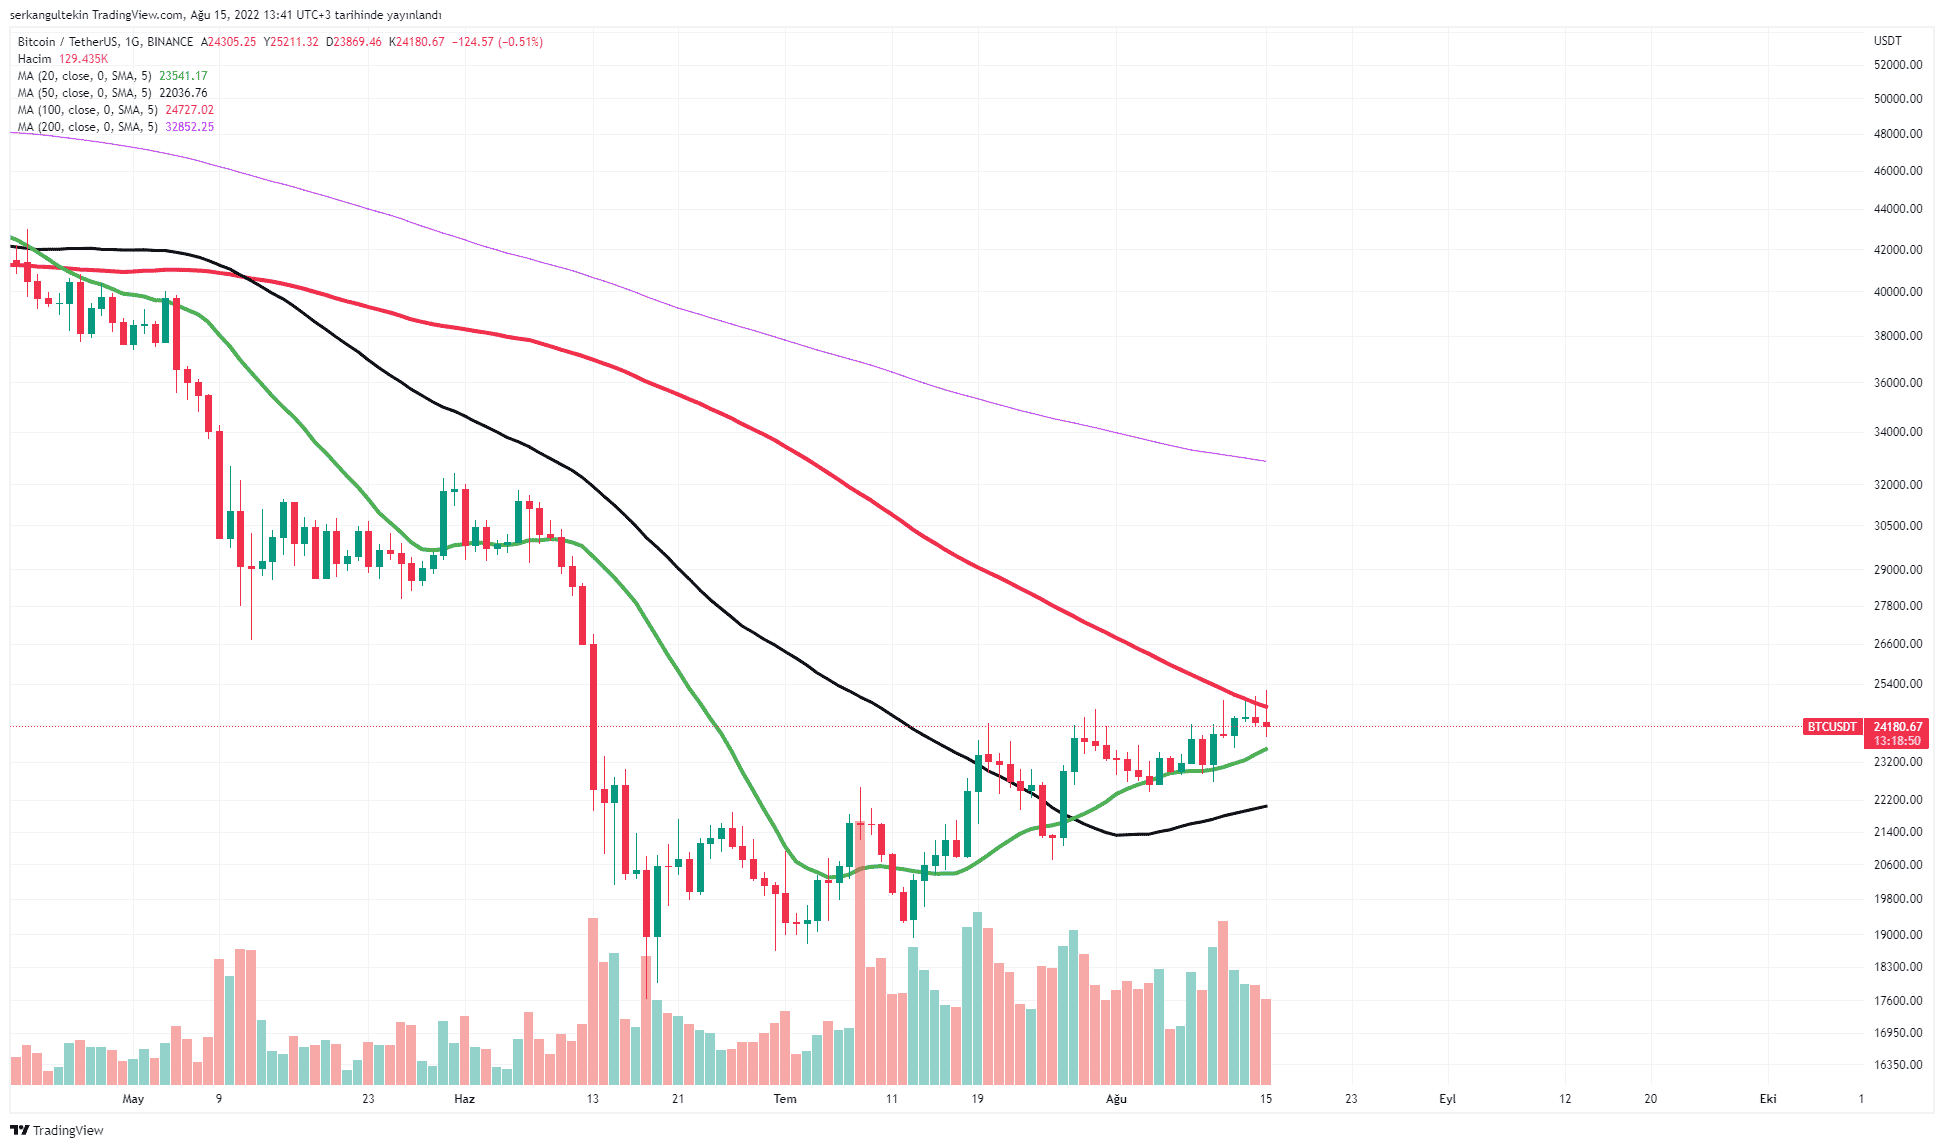
The increase in volume during the bottom also shows the importance of the weekly ma200. When we look at the daily chart, we see that the averages are getting closer to each other and there is a narrowing.
In this state, the rises that can be experienced up to $ 28600 in the upcoming period will not surprise us.
As a support and stop point, the above-mentioned $23.047 level can be followed.
*Not Investment Advice.