
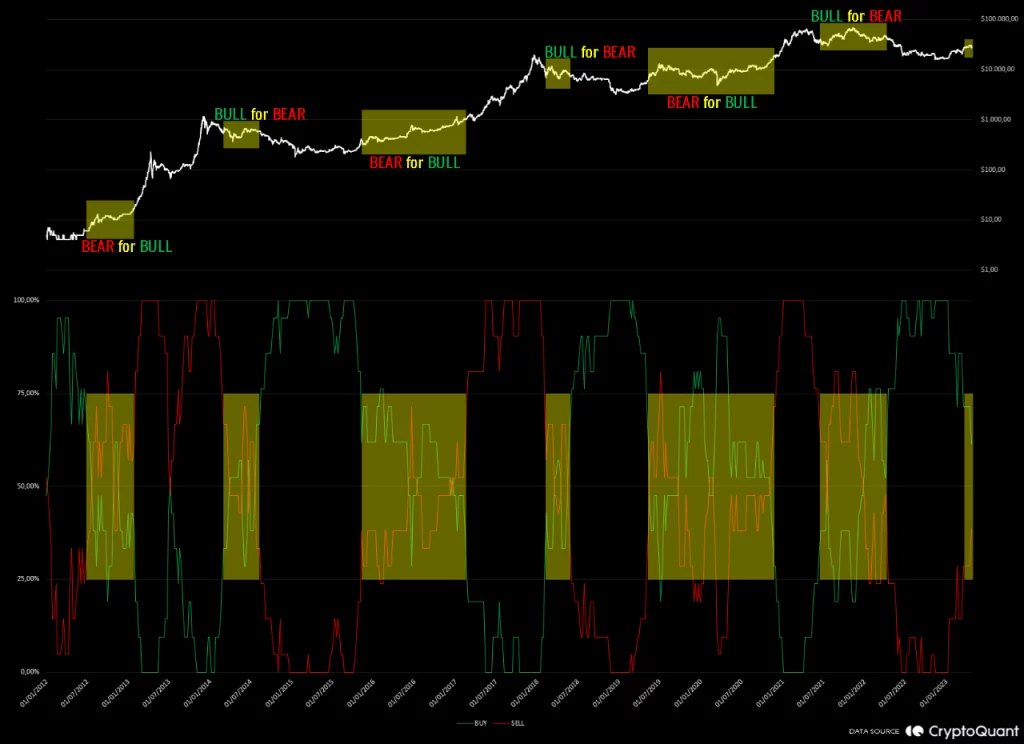
CryptoQuant, Index bitcoin He explained that Cycle Indicators have entered the historical trend transition phase, leaving the accumulation zone (buy signal) for the first time in a year. This period, marked in yellow, marks the macro trend transition phases of historical cycles, indicating that the market has moved from a bear market to a bull market or from a bull market to a bear market.
While it is not possible to say exactly when the bear market is over, the indicator has predicted correctly many times in the past. The index remained in the 75%-100% Accumulation range for at least 365 days, giving a buy signal and indicating a historical accumulation trend.
CryptoQuantThe Index provides detailed information on Bitcoin Cycle Indicators and explains that it allows the examination of moments of accumulation and distribution in the history of the market since 2012. Since April 2022, the index has given a buy signal and is related to the time associated with the Bitcoin Halving compared to previous accumulation cycles. there is an increase in demand.
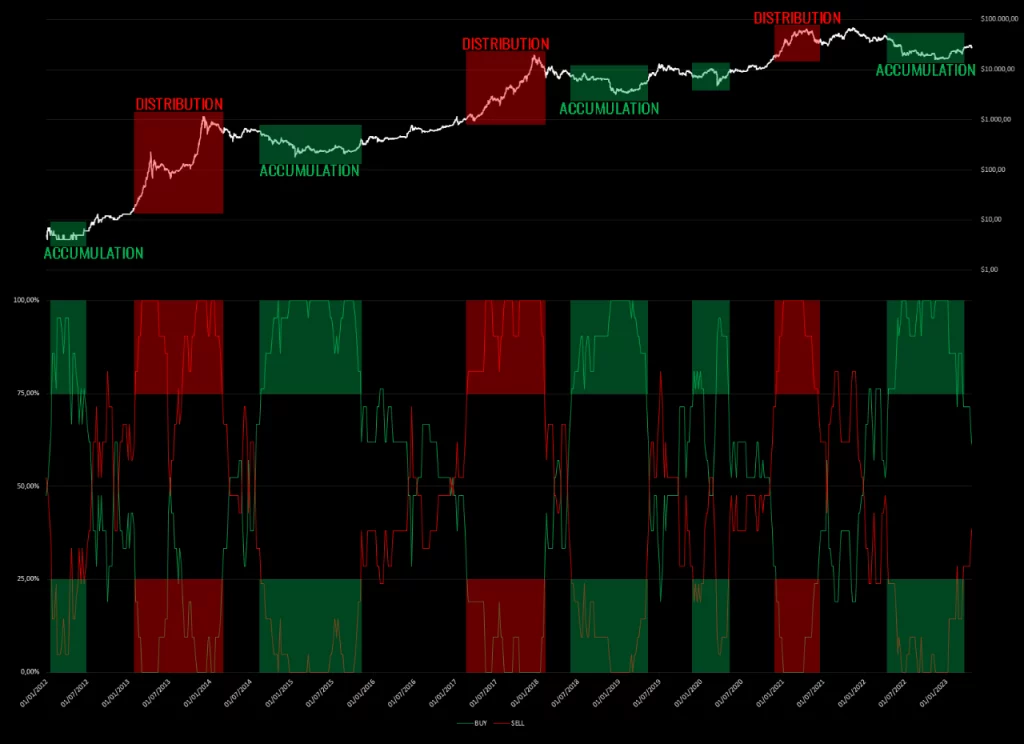
Bitcoin seems to have returned to the line indicated by 75%-100%, which it showed for the first time in the trend transition phase during the COVID-19 era. Based on historical data, it is likely that BTC has entered a phase of transition from a bear market to a new bull market. However, this does not mean that we will reach a new peak price later this year, but rather that we will not seek new lows.
You can follow the current price action here.