
Bitcoin (BTC) starts the new year below $50,000, which indicates that aggressive buying by traders is lacking. In recent developments on this weakness, former BTCC CEO Bobby Lee said the exits of Chinese traders who had until December 31 to exit Chinese stock markets may have kept prices low by the end of the year. In this article, let’s take a look at the latest developments from the market and examine the technical analysis of 4 altcoin projects.
What happened in the Bitcoin and altcoin market?
With Bobby Lee statements, El Salvador President Nayib Bukele, who was the first country to accept Bitcoin as legal tender, believes Bitcoin could rise to $100,000 this year. President Bukele also said that in 2022, two more countries will accept Bitcoin as legal tender. Increasing crypto adoption by institutional investors in 2021 is considered another long-term positive signal. According to CoinShares, net inflows to crypto funds were more than $9.3 billion in 2021. More than two-thirds of crypto entries were made to Bitcoin. So, can Bitcoin start a new upward move by pushing certain altcoin projects higher in January? Let’s take a look at analyst Rakesh Upadhyay’s technical analysis to answer…
Bitcoin technical analysis
Bitcoin has been trading between the 20-day EMA ($48,720) and strong support at $45,456 for the past few days. This suggests that buying is drying up at higher levels. On the technical side, both MAs are falling and the RSI is in the negative territory, suggesting that these bears have prevailed. If the price breaks from the 20-day EMA, the bears will attempt to push the price below $45,456. If they succeed, the next leg of the downtrend could start at $42,000 followed by $40,000.

Contrary to this assumption, if the price breaks above the 20-day EMA, the BTC/USDT pair could rise to the 50-day SMA ($52,332). A break and close above this level could mark the start of a fresh upward move that could reach the 61.8% Fibonacci retracement level from the $58,686 high.

The 4-hour chart shows that the pair is range-bound between $45,456 and $51,936.33. If the price rallied at $45,456 and the bulls push the pair above the 50 SMA, it will suggest accumulation at lower levels. This could lead the price towards $51,936.33. Conversely, if the price breaks from the 50 SMA, the bears will make another attempt to push the pair below $45,456. If they are successful, the pair could resume the downtrend with the next target target at $38,975.67.

Altcoin LUNA maintains contact with $100 resistance
Terra (LUNA) is trying to continue its uptrend but the bears have other plans, drawing a line around $93.81. The rising MAs and the RSI in the positive zone are giving the buyers a slight advantage. If the price bounces back from the 20-day EMA ($82) once again, it will indicate that the bulls continue to accumulate on the dips.

The LUNA/USDT pair will then attempt to break $93.81 and challenge the ATH level of $103.60. A break and close above this resistance could start the next leg of the uptrend at $135.26. Conversely, if the price drops and breaks below the 20-day EMA, it will signal a change in the short-term trend. The pair could decline to $65.15 later on.

The $81.11 bounce faces selling in the region between the 50% Fibonacci retracement at $92.35 and the 61.8% retracement level at $95.01. The bears will now try to push the price below the 20 EMA and the bullish line. If they do, the pair could drop to $84 and then to $81.11. A break and close below this support could indicate that the bears are back in the game. Conversely, if the price breaks out of the current level or uptrend, buyers will try to push the pair above $95.01 and retest the overhead resistance at $103.60.
Phantom (FTM) technical analysis
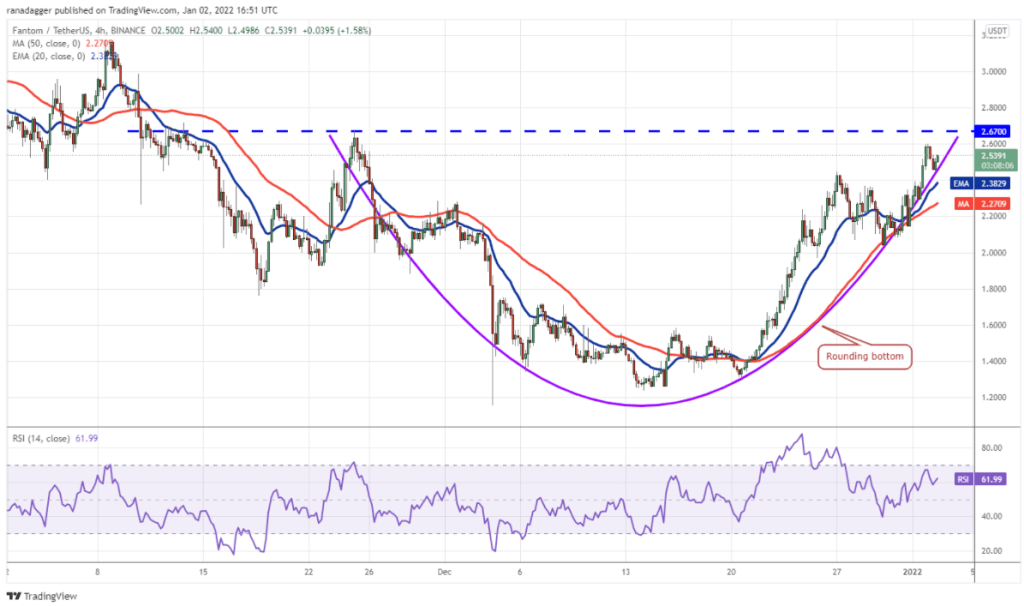
Phantom (FTM) broke the overhead resistance at $2.67, suggesting that the bears are fiercely defending this level. According to the analyst, the FTM/USDT pair could drop to the 20-day EMA, which could act as a strong support. A sharp rebound of this support will indicate that buyers are accumulating on the dips. The ascending 20-days EMA ($2.03) and the RSI above 68 suggest the path of least resistance to the upside. A break and close above $2.67 will indicate the bulls are back in the game. The pair could then start upwards towards $3.17 and then $3.48. The bears will have to push and sustain the price below $2 to invalidate the bullish sentiment.

The 4-hour chart shows a rolling bottom formation that will complete with a breakout and close above the overhead resistance at $2.67. If the price bounces back from the 20 EMA, the bulls will again try to break through the hurdle at $2.67. If this happens, the upward movement can begin. Conversely, if the price dips below the 20-EMA, it suggests that the short-term bullish momentum may weaken. The pair could then decline to the 50-SMA and later to the strong support at $2.
cryptocoin.com As we reported in our analysis, Cosmos (ATOM) broke above the general resistance at $34 on January 1 and closed. The MAs have completed the bullish crossover, which indicates that the bulls have prevailed. If the price stays above $34, the bullish momentum could increase further and the ATOM/USDT pair could rally to $38 and then to $43.28. Contrary to this assumption, if the price breaks and dips below $34, it will indicate that the bears are trying to trap the aggressive bulls. The pair could then drop to the 20-day EMA ($28).

If the price bounces back from this level, the bulls will make another attempt to break through the overall hurdle, but if the pair breaks below the MAs, the drop could extend to $25. Both MAs are rising and the RSI is in the positive zone, which indicates that the bulls have prevailed. If the price bounces back from the 20-EMA, it will indicate that the sentiment remains positive and traders are buying on the dips. The upside could continue with a breakout and close above $37. Conversely, if the bears pull the price below the 20-EMA, it could lead to booking profits from short-term traders. This could push the price towards the 50-SMA.

Altcoin Harmony (ONE) has reached the downtrend line where the bears are likely to form stiff resistance. If the price drops from the current level, the altcoin could drop to the 20-day EMA ($0.24). If the price bounces back from the 20-day EMA, it will indicate that sentiment continues to rise and traders are piling up on the dips. The bulls will then try to push the price above the downtrend line. If they succeed, it will suggest the start of a new upward move. The first target on the upside is $0.34, and a break above it could result in a retest at $0.38. This positive view will be invalidated if the price drops below $0.21.

The 4-hour chart shows the formation of a cup and handle pattern that will complete on a break and close above $0.29. This reversal setup has a formation target of $0.38. A direct line to the target target is unlikely as the bears are likely to form a strong resistance at $0.34. Conversely, if the price drops from the current level, the price could slide back into the MAs. If this support is broken, the ONE/USDT pair could drop to $0.21. A bounce from this support could hold the pair between $0.21 and $0.27 for a while.

Contact us to be instantly informed about the last minute developments. twitter‘in, Facebookin and InstagramFollow and Telegram and YouTube join our channel!

Disclaimer: The articles and articles on Kriptokoin.com do not constitute investment advice. Cryptokoin.com does not recommend buying or selling any cryptocurrencies or digital assets, nor is Kriptokoin.com an investment advisor. For this reason, Kriptokoin.com and the authors of the articles on the site cannot be held responsible for your investment decisions. Readers should do their own research before taking any action regarding the company, asset or service in this article.
Warning: Citing the news content of Kriptokoin.com and quoting by giving a link is subject to the permission of Kriptokoin.com. No content on the site can be copied, reproduced or published on any platform without permission. Legal action will be taken against those who use the code, design, text, graphics and all other content of Kriptokoin.com in violation of intellectual property law and relevant legislation.