
Gold and Bitcoin charts attract the attention of almost everyone. We do the readings accordingly. We also make our predictions this way. Now we have the Gold and Bitcoin chart. Let’s see what he will tell us?
Is the gold chart pointing to the bullish?
Gold bulls are waiting for a correction from the trendline support. Accordingly, bullish-oriented inverted head and shoulders are formed. Elsewhere, Gold headed for its best weekly gain since April on Thursday amid dovish sentiment surrounding the Federal Reserve. However, those gains were wiped out after strong NPL figures released on Friday. US employers employed 339,000 seasonally adjusted jobs, much more than expected. This indicates the possibility of a further rise in interest rates. So how did gold react to this situation? Let’s look at the graph below.
From a weekly perspective, the price for gold appears to be on the verge of breaking a support structure. But meanwhile, a bullish correction is also in the cards.
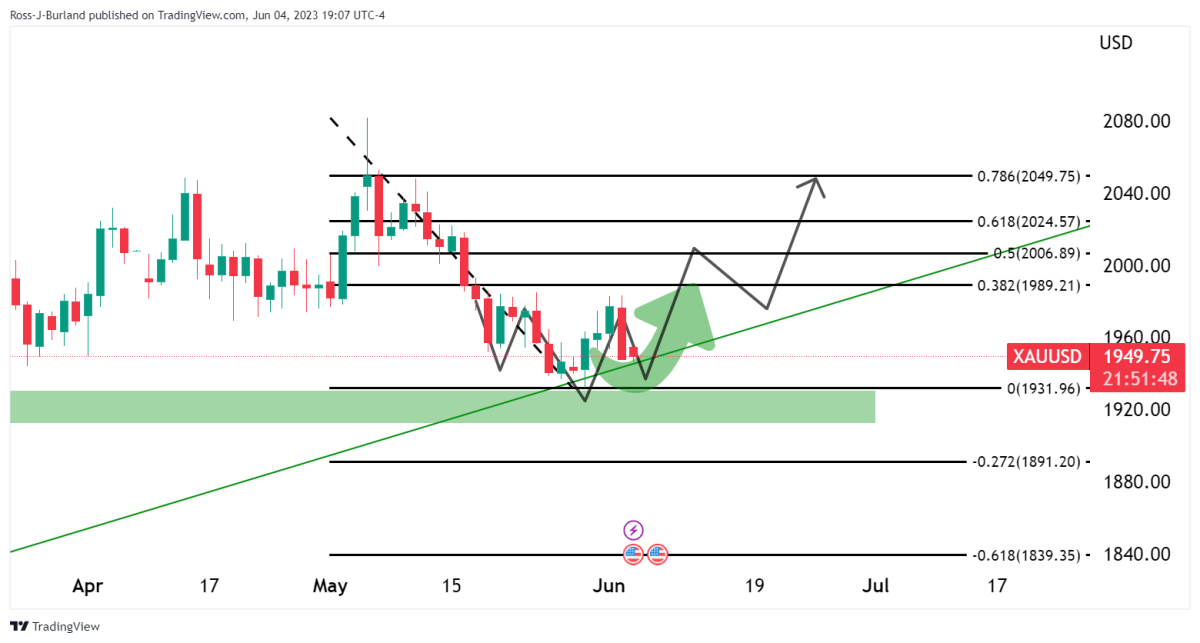
From a daily perspective, possible inverse head and shoulders will also be bullish on the charts. Right shoulder in line with trendline support. Additionally, from a 4-hour perspective, the price for gold is forming an M-formation.

The episode that took hold was the move reported ahead of last week’s opening. The market has since been trending downwards and sideways towards the rear of the previous bearish trendline. This means an average rise in the gold price for the coming days.
What does the Bitcoin price chart tell us?
The rises in the stock markets did not cause a similar performance in Bitcoin. To some extent, Bitcoin performs the same as gold. That said, several major cryptocurrencies have stopped the decline. Accordingly, this is a small positive development for him to try to start a recovery. Bitcoin has been trading close to the 20-day exponential moving average ($27,233) for the past three days. This indicates that the bulls have bought the drop around $26,500.

The 20-day EMA has flattened and the relative strength index (RSI) is just below the midpoint. Accordingly, this indicates that there is a balance between supply and demand. This balance will shift in favor of buyers if they push the price above the resistance line of the descending channel pattern. This makes it possible to start a northward march towards $31,000. If the price turns down from the resistance line, it will show that the BTC/USDT pair may spend some more time inside the channel. On the downside, the critical level is $25,250. A break and close below this support could intensify the selling and push the price towards $20,000.

The four-hour chart shows the bears holding the immediate resistance at $27,350. On the downside, the pair is forming higher lows indicating lower demand in the near term. This increases the likelihood of a rally above overhead resistance. If this happens, the pair could move up to the resistance line of the descending channel. If the bears are looking to gain the upper hand, they will need to quickly slide the price below the nearest support at $26.505. cryptocoin.com On the downside, the next stop could be $26,360 followed by $25,800.
Contact us to be instantly informed about the last minute developments. twitter‘in, Facebookin and InstagramFollow and Telegram And YouTube join our channel!
Risk Disclosure: The articles and articles on Kriptokoin.com do not constitute investment advice. Bitcoin and cryptocurrencies are high-risk assets, and you should do your due diligence and do your own research before investing in these currencies. You can lose some or all of your money by investing in Bitcoin and cryptocurrencies. Remember that your transfers and transactions are at your own risk and any losses that may occur are your responsibility. Cryptokoin.com does not recommend buying or selling any cryptocurrencies or digital assets, nor is Kriptokoin.com an investment advisor. For this reason, Kriptokoin.com and the authors of the articles on the site cannot be held responsible for your investment decisions. Readers should do their own research before taking any action regarding the company, assets or services in this article.
Disclaimer: Advertisements on Kriptokoin.com are carried out through third-party advertising channels. In addition, Kriptokoin.com also includes sponsored articles and press releases on its site. For this reason, advertising links directed from Kriptokoin.com are on the site completely independent of Kriptokoin.com’s approval, and visits and pop-ups directed by advertising links are the responsibility of the user. The advertisements on Kriptokoin.com and the pages directed by the links in the sponsored articles do not bind Kriptokoin.com in any way.
Warning: Citing the news content of Kriptokoin.com and quoting by giving a link is subject to the permission of Kriptokoin.com. No content on the site can be copied, reproduced or published on any platform without permission. Legal action will be taken against those who use the code, design, text, graphics and all other content of Kriptokoin.com in violation of intellectual property law and relevant legislation.