
Ethereum The price has once again been rejected by a key resistance zone, indicating that the correction may continue.
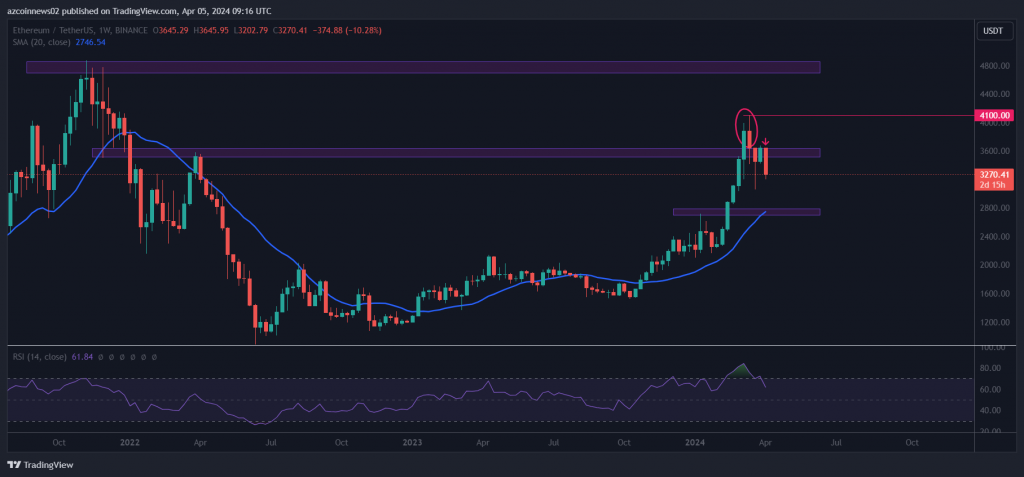
The price of Ethereum broke above the long-term resistance zone at $3,550 in the week of March 4 – March 10, 2024. This was the last level of resistance before the all-time high at $4,800.
However, ETH price only reached a yearly high of $4,100 and subsequently fell below $3,550. This movement shows that the previous breakout was just a divergence (red ellipse) and is usually followed by a sharp decline.
As Koinfinans.com reported, the price confirmed $3,550 as resistance this week and showed a sharp decline. The weekly RSI has fallen below 70 and is sloping downwards, indicating that the bears are back. Therefore, ETH price might continue to decline towards the $2,700 support zone formed by the previous resistance zone and the 20-week MA line.
The daily chart shows Ethereum price bouncing up from a minor horizontal support zone at $3,250 on April 2. However, the weak recovery over the last 3 days indicates a lack of buying pressure at higher levels.
The daily RSI has broken below the 50 level and is sloping downwards, indicating that the bears are controlling the short-term price action. Therefore, ETH price may decline below the horizontal support zone at $3,250 in the coming days.
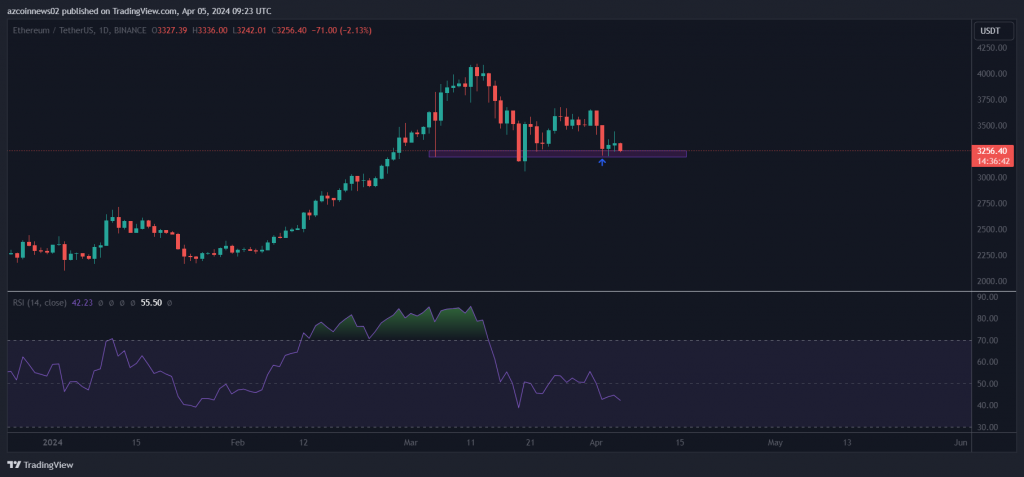
The most likely outlook suggests that ETH price will decline below the horizontal support zone at $3,250 and decline towards $2,700 in the near future.
The bearish view will be invalidated if ETH price rises above the $3,500 zone on the weekly time frame.
