

Declining below a critical support line Ethereum (ETH)The lower bound of the technical pattern that ruled after this pullback could continue to decline after $2944. The prevailing pattern seems to indicate a 15% bearish target towards $2472.

Ethereum pricedropped below the lower bound of the “rising wedge pattern,” putting the target back on the radar to a pessimistic $2472 target. The first support line for Ethereum price is located at the 38.2% Fibonacci retracement level at $2855.
Additional support levels could emerge at the 50 twelve-hour Simple Moving Average (SMA) at $2772, followed by the 50% retracement level at $2722.
If the selling pressure continues to build, Ethereum price could drop to the support line given by the Momentum Reversal Indicator (MRI) at $2672.
An increase in bearish sentiment could push Ethereum price down to the 61.8% Fibonacci retracement level at $2589, which acts as the last support line before ETH hits the bearish target of $2472.
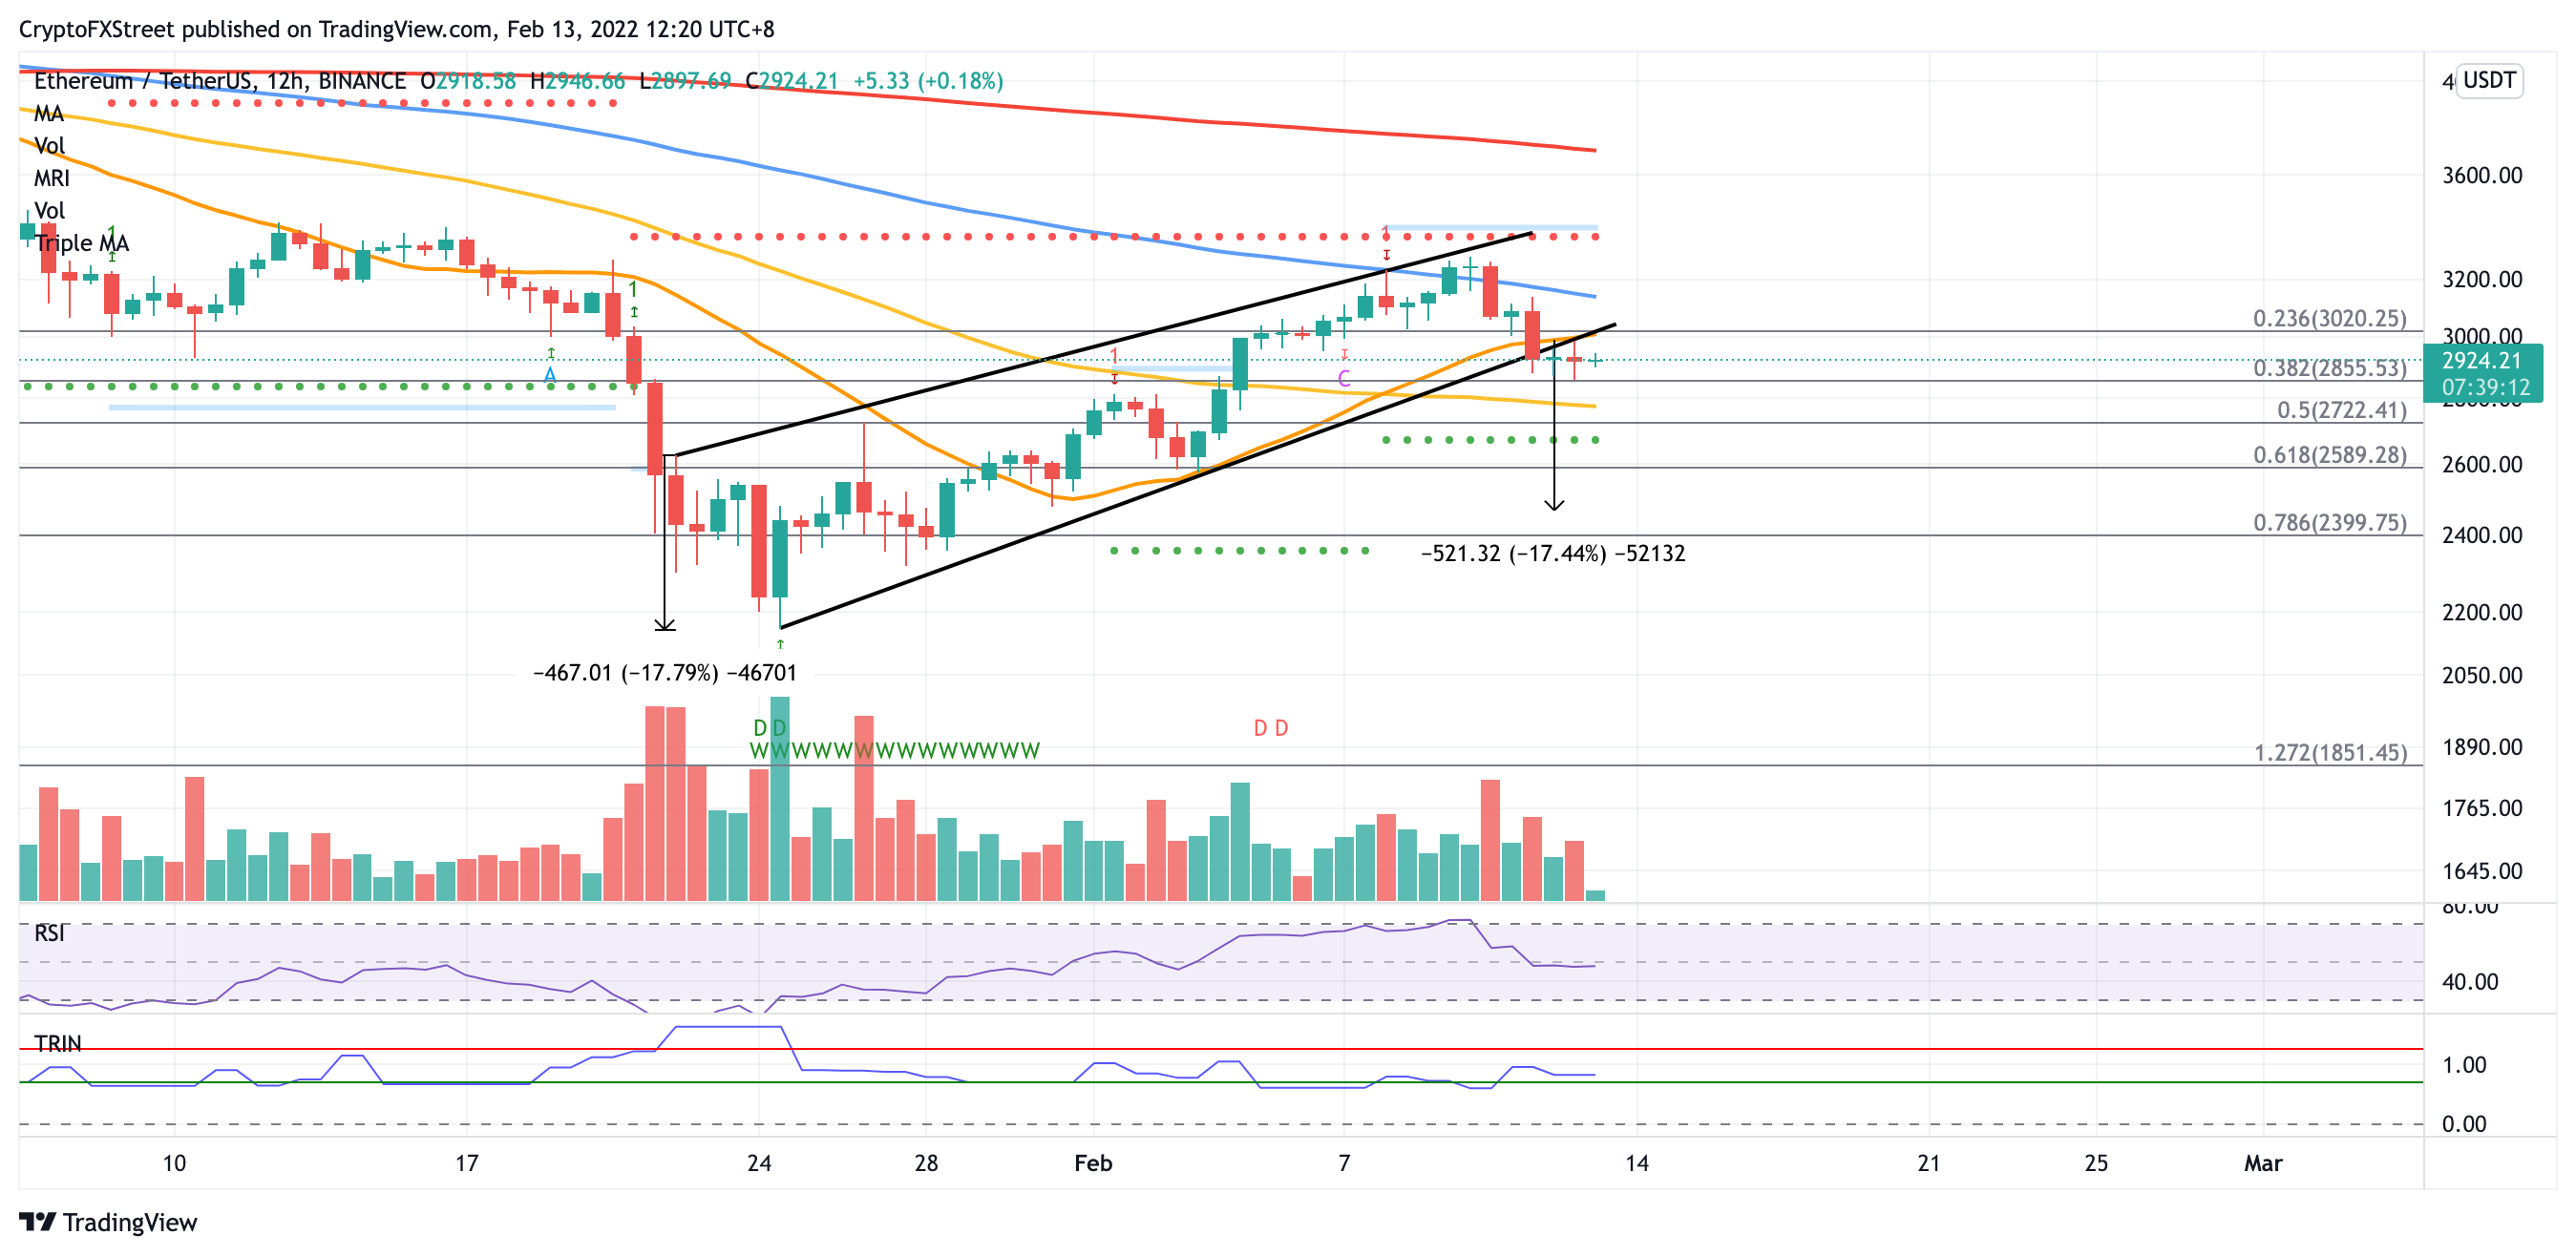
However, if purchasing pressure increases, ETH priceIt could target the next $3020, where the 21 twelve hourly SMA and the 23.6% Fibonacci retracement level overlap. An additional spike in buy orders could push Ethereum price as high as the 100 twelve-hour SMA, then $3134, then the MRI’s resistance line at $3357.
If the overall sentiment turns bullish, greater prospects could target the 200 twelve-hour SMA at $3698.
Disclaimer: What is written here is not investment advice. Cryptocurrency investments are high-risk investments. Every investment decision is under the individual’s own responsibility. Finally, Koinfinans and the author of this content cannot be held responsible for personal investment decisions.