
Rekt Capital, one of the leading analysts of the cryptocurrency market, states that an important technical pattern regarding the Bitcoin (BTC) price has been completed. The analyst emphasizes that BTC has almost formed a complete double top pattern after its recent declines.
The double top pattern is considered one of the classic indicators of technical analysis and usually indicates that the price of an asset is approaching or has peaked. This may represent a point where investors begin to sell or consider selling the asset. The analyst predicted more than a month ago that the completion of this pattern could send Bitcoin towards $22,000. he said.
The analyst said in early August:
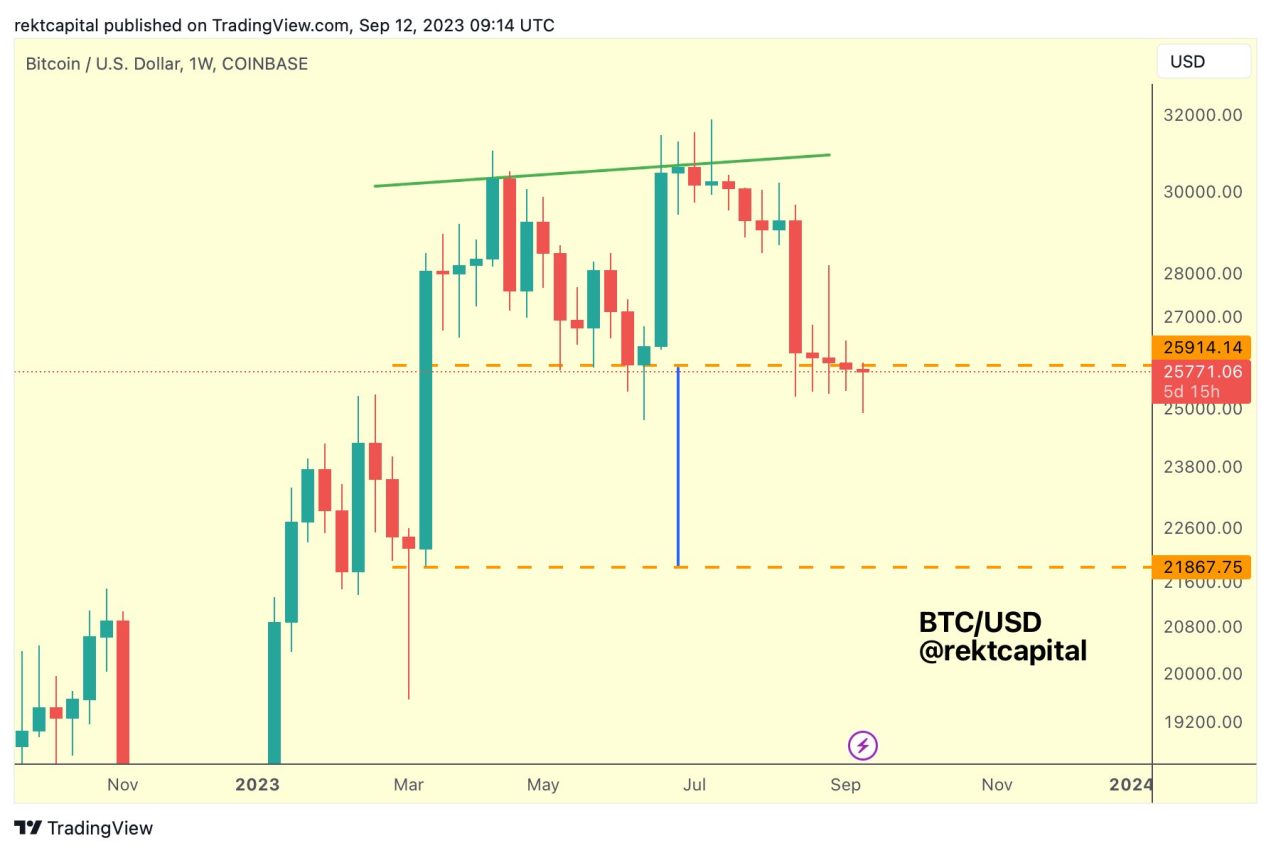
“A Double Top could occur if BTC drops to around $26,000 by mid-September.
A breakout of around $26,000 would confirm a Double Top
And a conservative move for the Double Top would be around $22,000.
“It’s notable, but it’s still in the very early stages and a lot can still change in the meantime.”
Now, with BTC hovering around $26,000, the analyst noted that the double-top pattern is now in play.
“BTC Double Top is happening
Slowly but surely.”
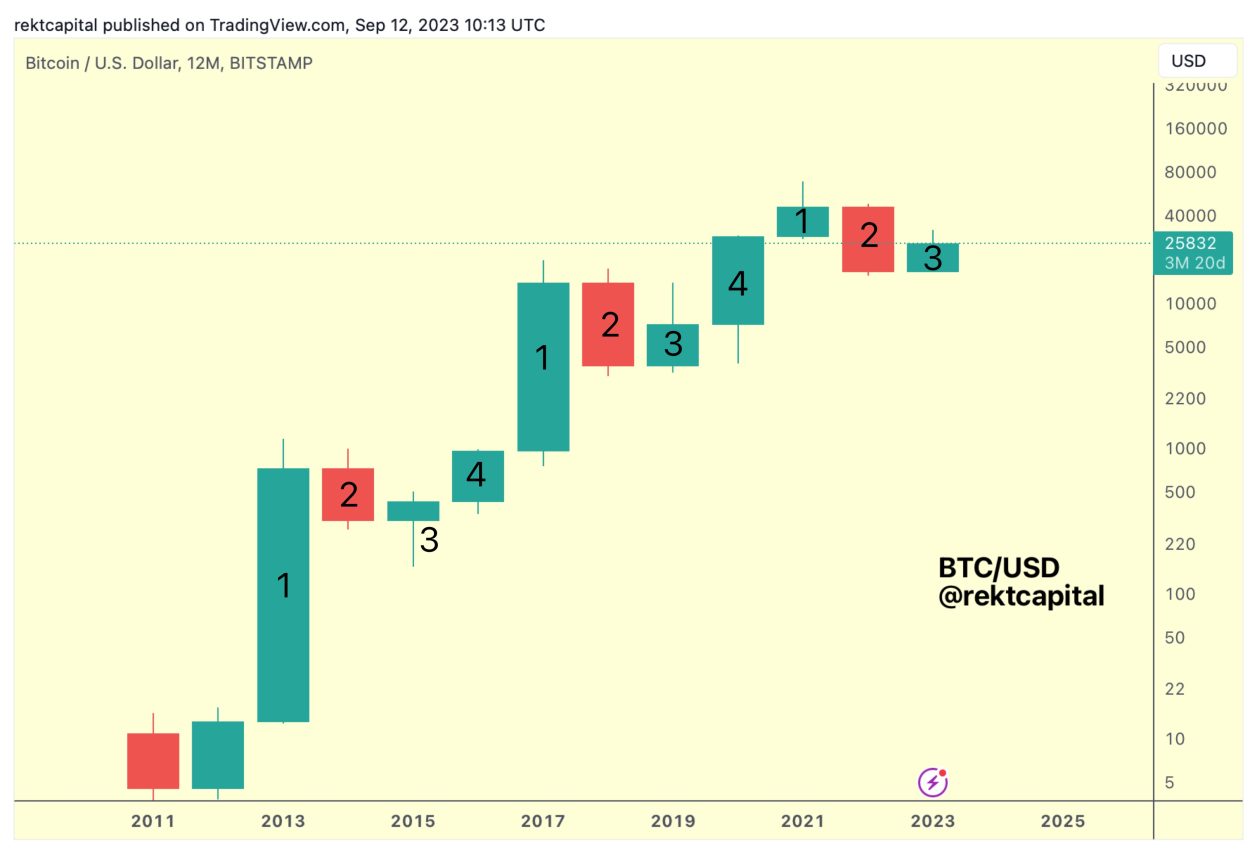
However, the analyst also examined the long-term outlook of Bitcoin. For this, Rekt used annual candles to depict BTC’s traditional four-year cycles. According to the analyst, since prices have historically traded sideways above and below the annual opening level, there are both upper and lower wicks on the candle in the third year of each cycle. However, Rekt claims that Bitcoin is unlikely to close below its annual opening level this time.
“We tend to see both upside and downside wicks on BTC Candle 3
2015 and 2019 show that negative wicks tend to occur later in the year
And negative wicks usually occur early in the year
“At this stage, it is unlikely that BTC will create a downside wick in 2023.”
You can follow the current price movement here.