
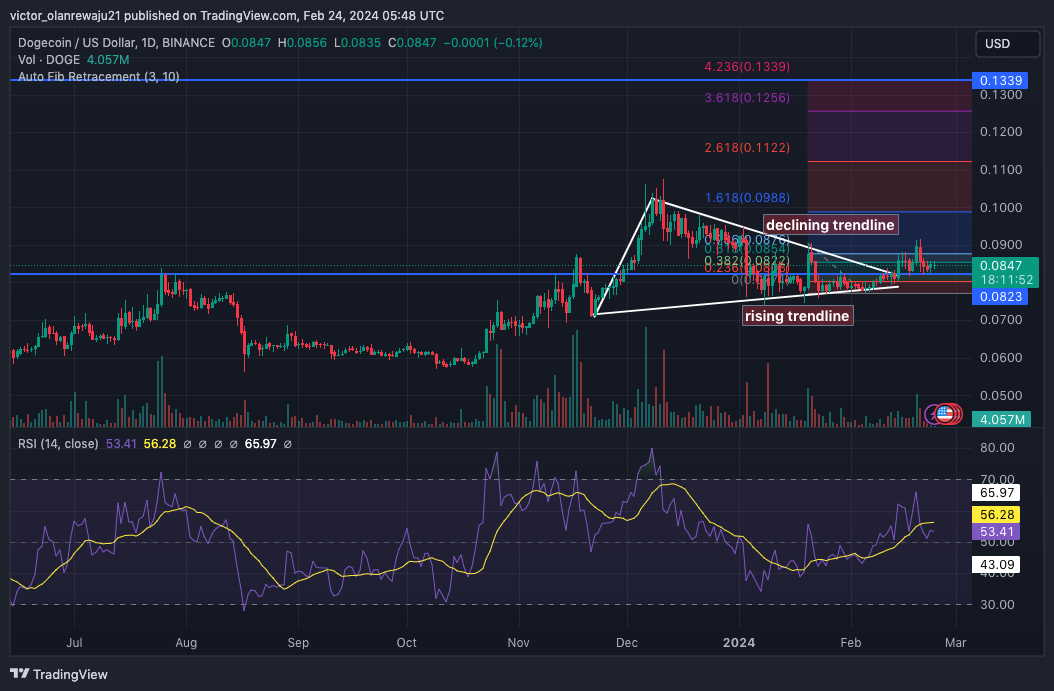
Popular meme coin dogecoin (DOGE) formed an asymmetric triangle on the daily chart. This is an indication that the bulls are trying to keep the price above $0.090. However, the bulls’ attempts failed as the bears pulled the price back.
The asymmetrical triangle formation indicates that a breakout may be ahead for Dogecoin. However, it is possible for DOGE to drop in price before the potential rally. At the time of writing, the price of the cryptocurrency was $0.084.
Bulls and Bears Fight
Indicators from the Relative Strength Index (RSI) pointed to a decline in bullish dominance. If the RSI value falls below 50.00, DOGE may decline to $0.080. However, the bulls will likely try to push the price up.
For example, if the bears pull back in price, Dogecoin is likely to drop to $0.0823, where the 0.236 Fibonacci retracement is located. If the price recovers from this level, DOGE could start an uptrend towards $0.133, where the 4.236 Fibonacci retracement is positioned.
On the other hand, the bullish thesis could be invalidated if the price falls below $0.080. Such a scenario would indicate bearish dominance amid increasing selling pressure. In this case, DOGE could decline towards $0.071. This is likely to make it difficult to experience major relief.
DOGE to $10? Analyst Explains His Thesis
Recently, analyst Ali Martinez shared that a breakout of DOGE at X could be much higher than a rise to $0.133. According to Martinez, meme coin It had formed a pattern similar to the one it had in 2020 on the weekly chart.
At that time, Dogecoin’s price had increased by 28,770%. Analyst, in his articleHe also noted that DOGE’s potential breakout of the descending triangle could trigger another bull run for the coin. From the chart he shared, he suggested that DOGE could approach $10 at some point.
The price action of #dogecoin is showing familiar patterns reminiscent of its 2020 behavior. Back then, $DOGE broke out from a descending triangle, entered a period of consolidation, and then skyrocketed by 28,770%.
Currently, #DOGE appears to be mirroring this pattern: having… pic.twitter.com/69yXnlYRJd
— Ali (@ali_charts) February 23, 2024
Meanwhile, the Supertrend indicator on the 4-hour DOGE/USD chart showed a sell signal near $0.089, confirming why it is difficult for the coin to move above $0.090. However, the indicator also showed a buy signal at $0.083.
Therefore, traders who buy DOGE around this level could be profitable if the price bounces from lower levels. Additionally, the Money Flow Index (MFI) rose to $65.30, indicating an increase in capital inflows.
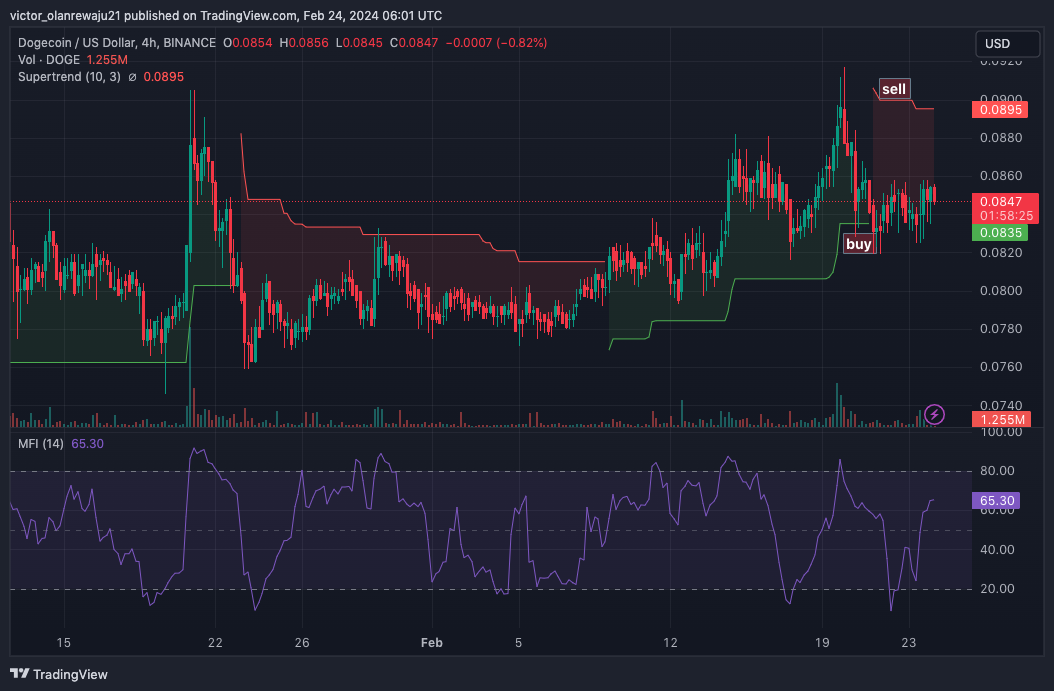
This jump was also evidence of buying pressure. If buying pressure continues to build, it’s possible that DOGE’s price could be set for a major rally. If the price breaks above $0.090, DOGE is likely to move towards a target of $0.13 in the short term.
