
Most major altcoins, including Bitcoin and DOGE, are facing higher selling levels. However, there are currently no signs of panic selling, according to crypto analyst Rakesh Upadhyay. What are the critical support levels to watch on the downside? Will lower levels attract buyers? The analyst examines the charts of the top 10 cryptocurrencies to find out about them.
An overview of the cryptocurrency market
cryptocoin.comBitcoin and altcoins have been volatile in the past two days as crypto markets digest lawsuits filed by the United States Securities and Exchange Commission (SEC) against the two largest crypto exchanges, Binance and Coinbase. After the initial reaction to the news and the ensuing recovery, markets are likely to enter a range as the uncertainty around the lawsuits eases. Initial reaction was encouraging as markets did not crash. This points to the growing maturity of the crypto space.
Glassnode data shows a 12,600 BTC drop in exchange balances on June 5 and 6. This shows that investors are keeping their cool. It’s also a sign that they’re not panicking like they did with the FTX incident back in November.
BTC, ETH, BNB, XRP and ADA analysis
Bitcoin (BTC) price analysis
Bitcoin’s pullback from vital support at $25,250 on June 6 shows that the bulls are fiercely trying to protect this level. However, the recovery faces selling near the moving averages.
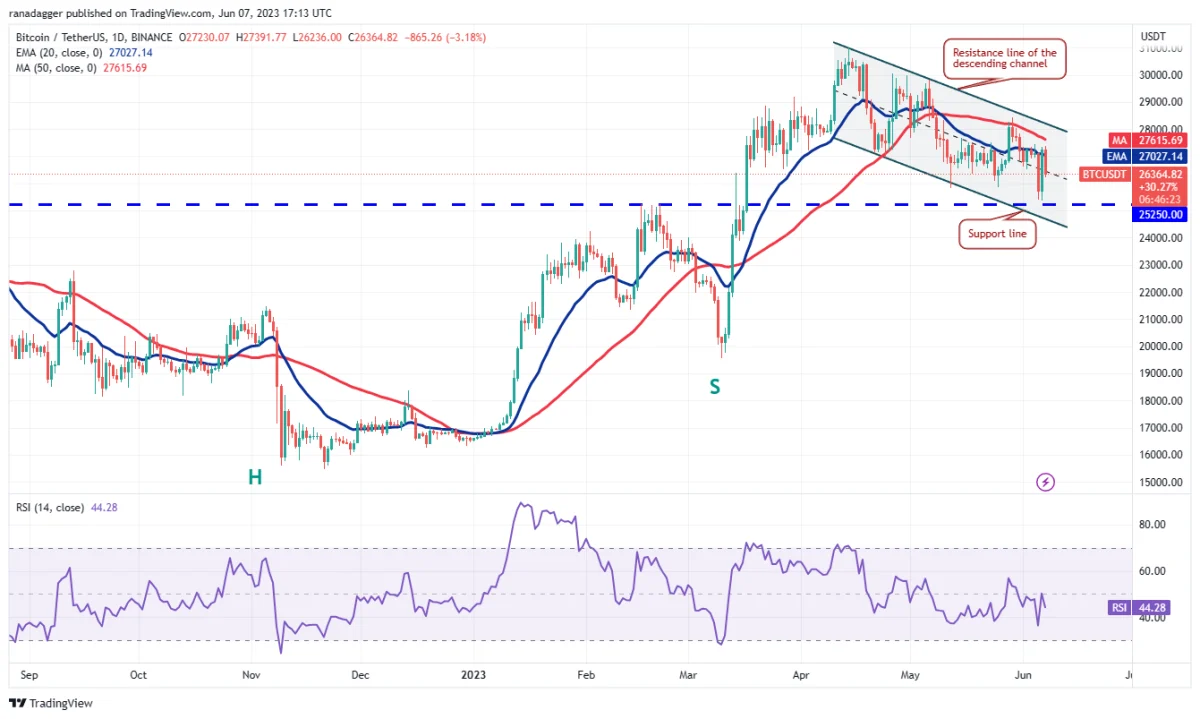
The bears will make another attempt to drive the price down to $25,250. This remains the key level to consider. Because a break and close below this could open the doors for a potential drop to $20,000. It is possible that such a deep fall will delay the start of the next leg of the upward move. The bulls are likely to buy the dips aggressively to the zone between $25,250 and the support line of the channel. On the upside, buyers will need to push the price above the resistance line of the channel to signal the end of the corrective phase. BTC is likely to rally to $31,000 later.
Ethereum (ETH) price analysis
ETH broke below the resistance line of the falling wedge formation on June 5. But the bears failed to get stronger. This indicates lower levels of demand.

The bulls pushed the price back above the moving averages on June 6th. However, it faced heavy selling pressure from the bears. Sellers will again try to push the price into the wedge. If they do, ETH is likely to extend the fall to the support line of the wedge. Conversely, if the price rebounds from the resistance line of the wedge, it will indicate that the bulls have turned the line to support. Buyers will need to push the price above $1,928 to begin the march north towards $2,000 and then $2,200.
Binance Coin (BNB) price analysis
BNB fell sharply on June 5th. In the process, it dragged the price below the strong support of $280. However, the bears did not let the price stay above $280. It was a weak attempt to start a recovery on June 6th.

Sales resumed on June 7th. Thus, the bears dragged the price below the key $265 support. This is a negative sign. Because it indicates the start of a fresh downside move towards $240 and then the vital support at $220. If the bulls want to make a reversal, they will need to push the price above the $265 breakdown level. If they do, it is possible for BNB to rise to $280 and then to the 20-day exponential moving average (EMA) at $299.
Ripple (XRP) price analysis
On an up move, traders usually take the drop to the 20-day EMA ($0.49). They did just that in XRP on June 5 and 6 as seen from the long tail on the candlesticks.
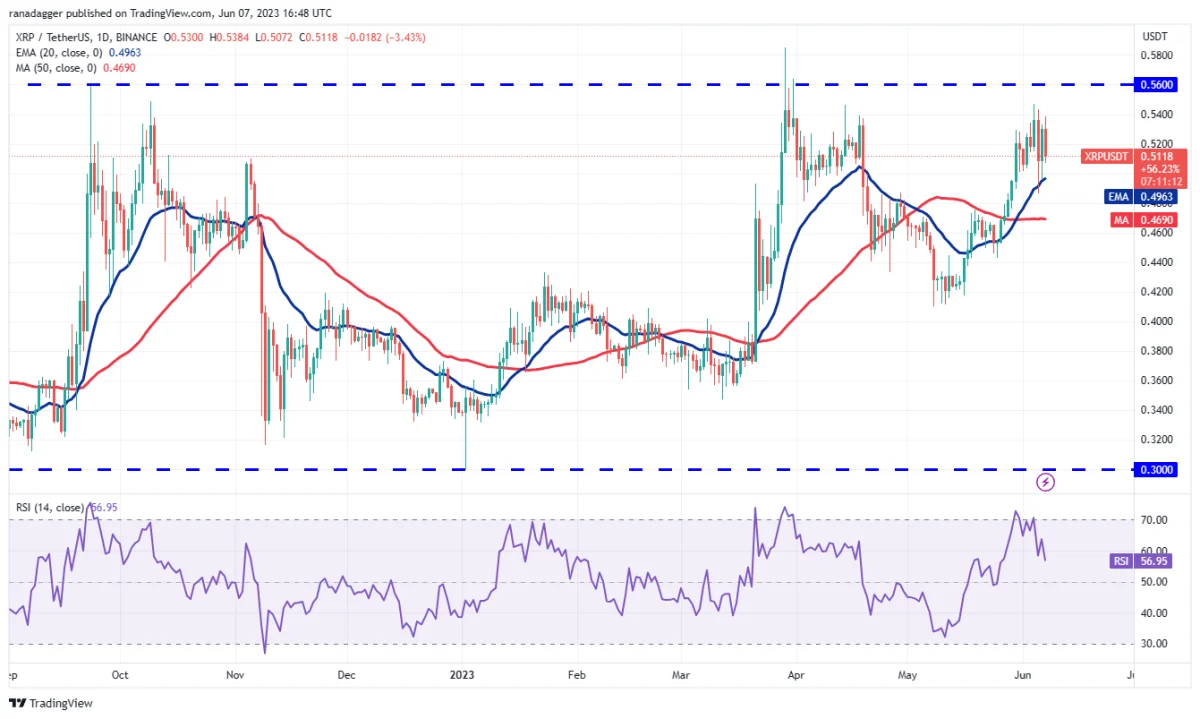
But bears are not ready to give up easily. They continue to sell on rallies between $0.56 and $0.59 into the resistance zone. If the price drops sharply and breaks below the 20-day EMA, it will indicate that the bears want to keep the $0.30 to $0.56 range intact. Meanwhile, buyers are likely to have other plans. They will try to break through the overhead barrier. If they do, they will indicate the start of a new uptrend. In this case, it is possible for XRP to rally as high as $0.60 and then $0.80.
Cardano (ADA) price analysis
ADA broke below the uptrend line of the ascending triangle formation on June 5. Thus, it invalidated the bullish pattern.
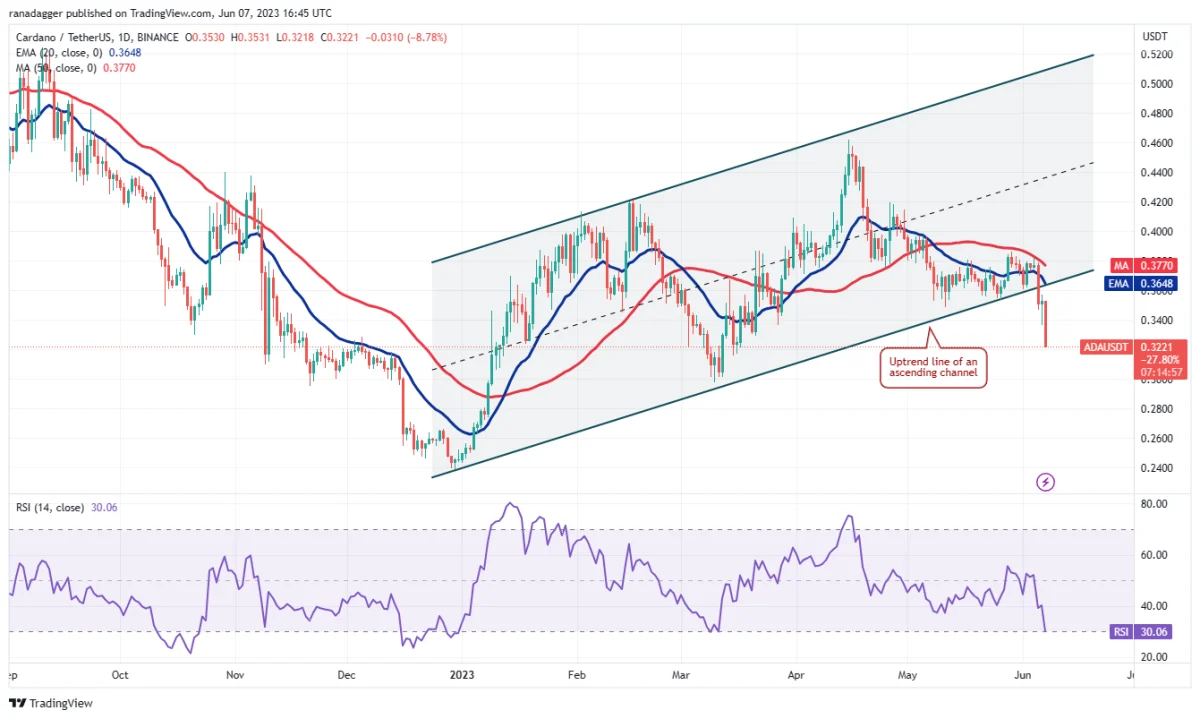
The bulls bought the June 5 dip. However, it failed to pull the price back into the channel. This shows that the bears are trying to turn the uptrend line into resistance. Sales continued on 7 June as well. In the process, the bears dragged the price below $0.33. Therefore, ADA is likely to descend to the strong support at $0.30. On the upside, the first sign of strength will be a close inside the channel. Such a move will indicate that the break below the channel could be a bear trap. XRP is likely to pull off a strong buy above $0.39.
DOGE, MATIC, SOL, DOT and LTC analysis
Dogecoin (DOGE) price analysis
DOGE broke below the $0.07 close support on June 5. However, it recovered sharply from support near $0.06.
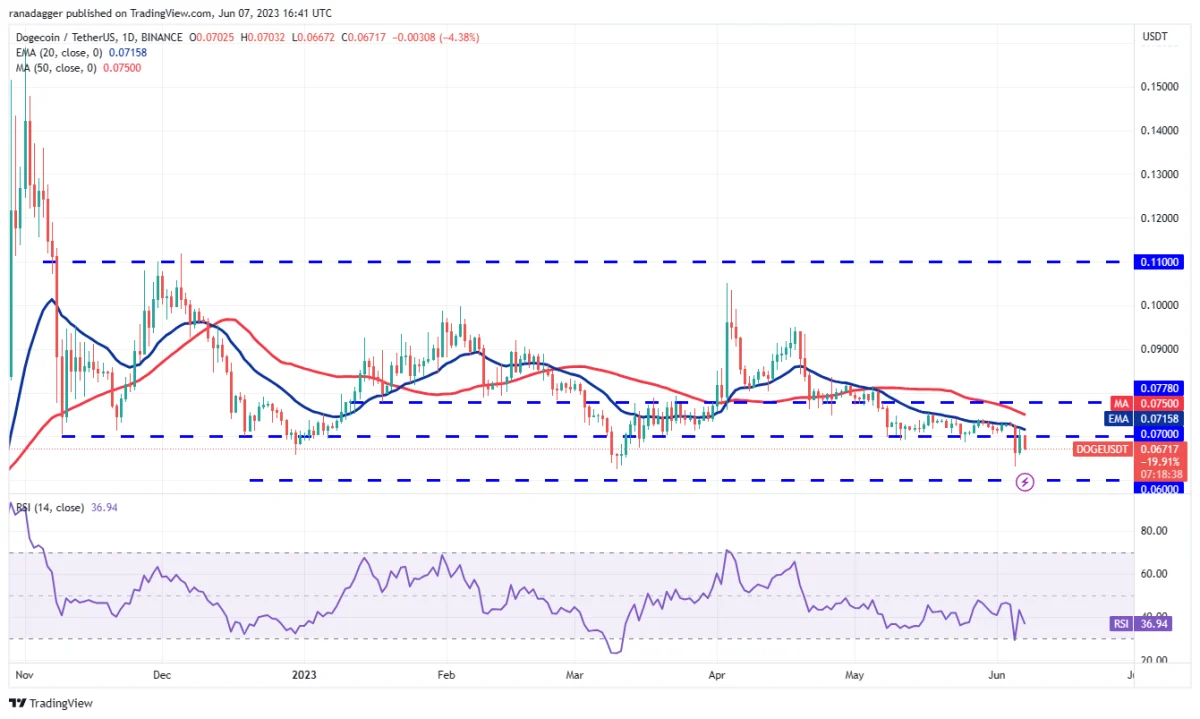
The bulls tried to push the price above the 20-day EMA ($0.07) on June 6. But the bears sold the rally. This shows that the DOGE bears are not giving up and continue to sell near the stiff resistance. The downward sloping moving averages and the relative strength index in the negative territory suggest that the bears have an advantage. Therefore, the bears will try to push the price below $0.06. If the bulls want a reversal, they will have to push the price above the 20-day EMA. It is possible that DOGE will try to move higher to $0.08 later.
Polygon (MATIC) price analysis
MATIC broke below the $0.82 support on June 6. However, the bulls bought the dip aggressively, as seen by the long tail on the day’s candlestick.
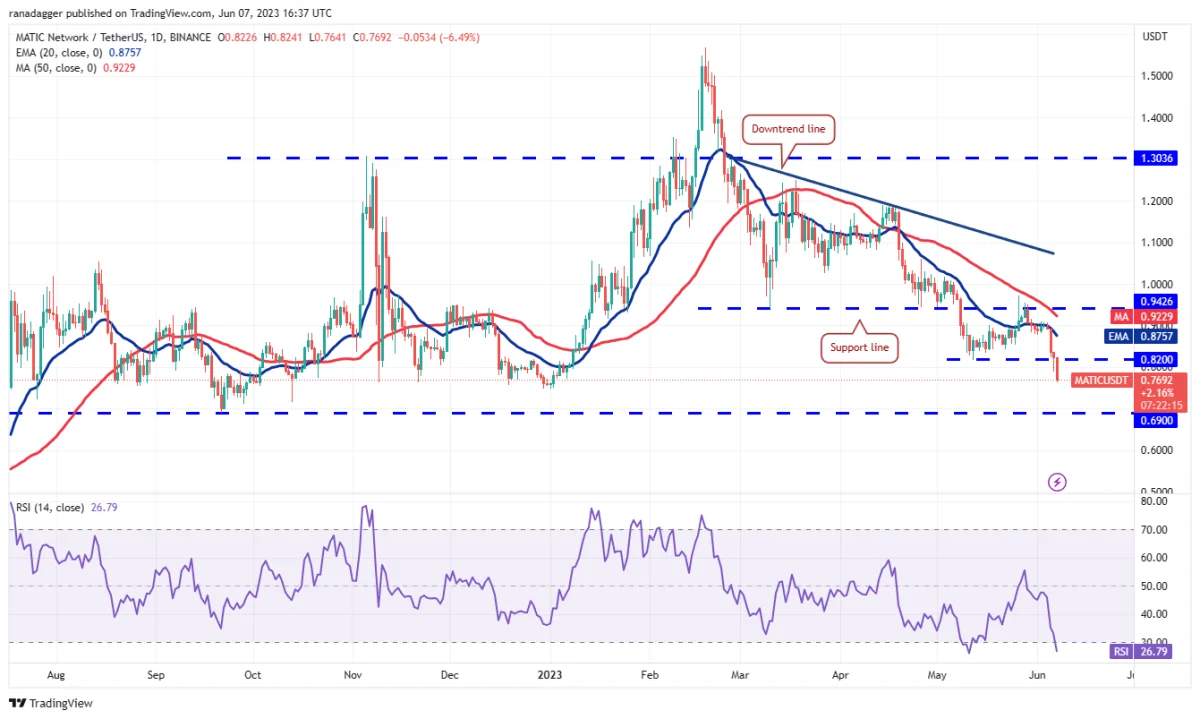
Buyers tried to keep the price above the $0.82 breakout level. But the bears had other plans. The bears sold aggressively on June 7. Thus, it dragged the price below the June 6 low of $0.79. This indicates the resumption of the downtrend. MATIC is likely to drop to the strong support at $0.69 in the next phase. If the bears want to avoid the decline, they will need to push the price above $0.82 quickly. It is possible that this could trap aggressive bears. This could result in a short squeeze that could push the price towards $0.94.
Solana (SOL) price analysis
The SOL recovered from the strong support at $18.70 on June 5 and 6 as seen by the long tail on the day’s candlesticks. However, the bulls failed to break the hurdle at the 20-day EMA ($20.50).
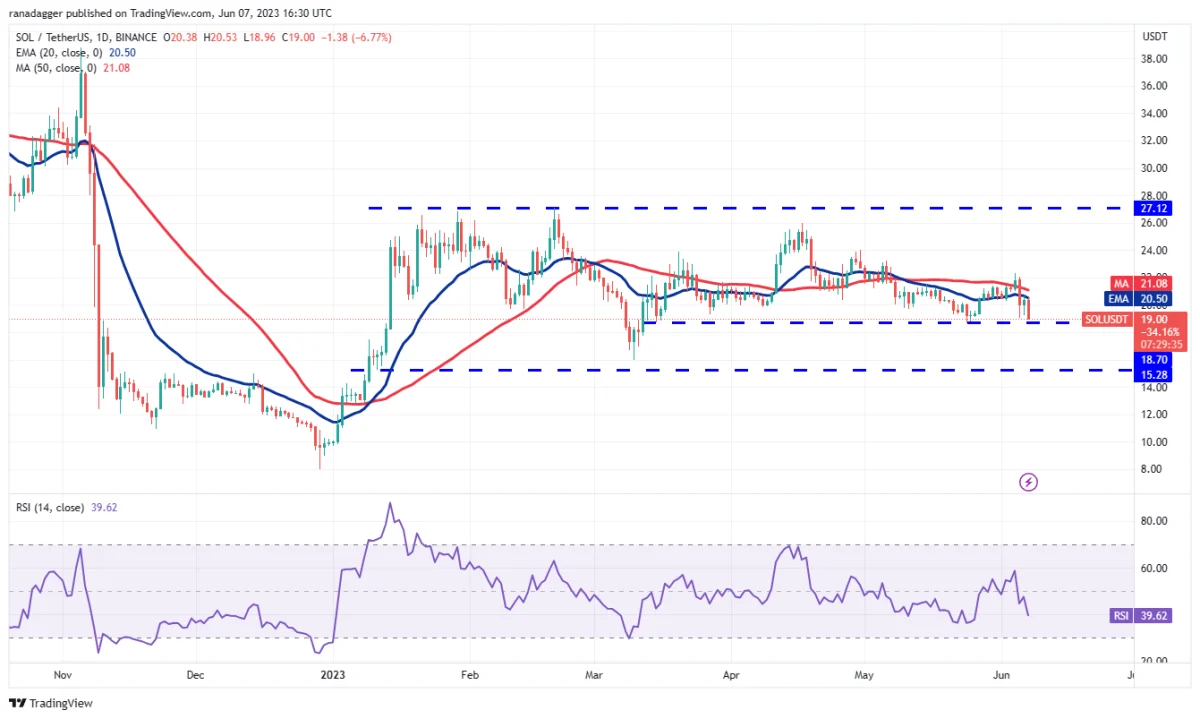
This indicates that the bears remain active at higher levels. If the price continues to decline and breaks below the $18.70 support, the SOL is likely to start a downside move towards the next support at $15.28. Alternatively, if the price rebounds from the current level or $15.28, it will indicate demand at lower levels. The bulls will then try to push the price above $22.30. If they are successful, it is possible for SOL to try to move higher to $24 and then to $27.12.
Polkadot (DOT) price analysis
DOT broke below the critical support of $5.15 on June 5. However, on June 6, it made a sharp jump and broke above the breaking level.
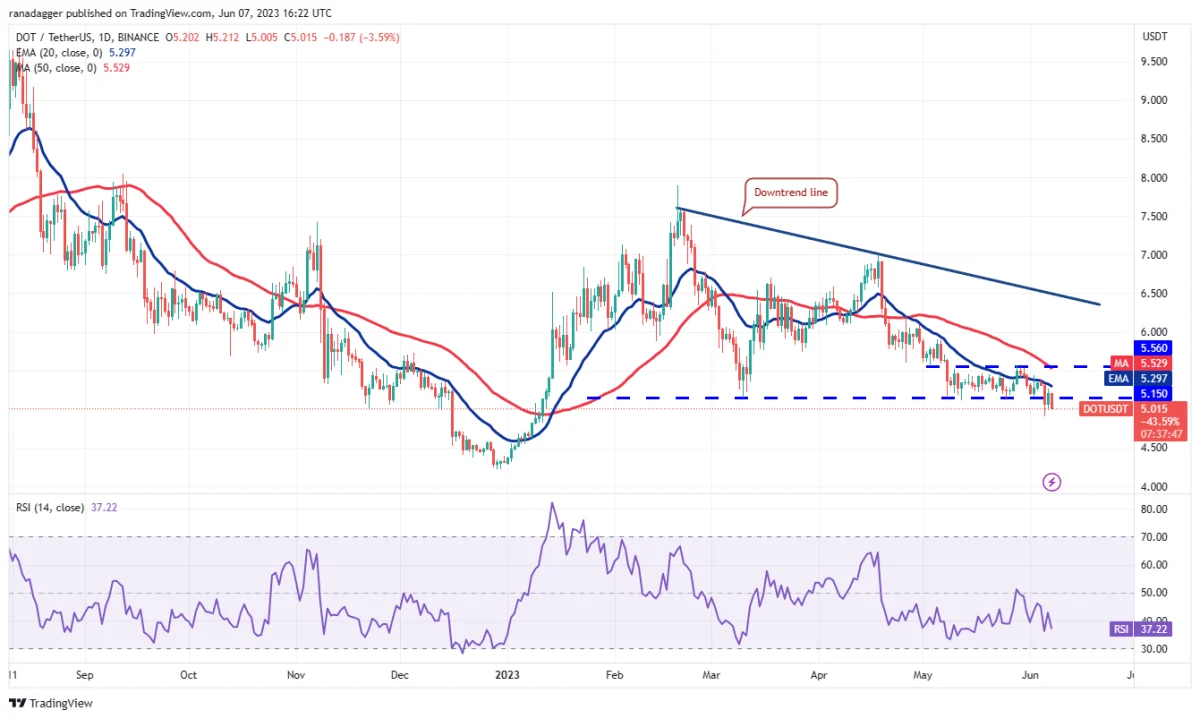
The bulls were unable to continue their recovery on June 7 as the bears sold out on the minor rally. Sellers will try to further strengthen their positions by pulling the price below $4.90. If they do, the DOT is likely to drop as low as $4.22. On the upside, the first important resistance to look out for is the 20-day EMA ($5.29). A rally above this level will be the first indication that selling pressure may ease. DOT is likely to gain momentum above $5.56.
Litecoin (LTC) price analysis
LTC fell below the moving averages on June 5th. However, it rebounded sharply on 6 June. However, the bulls failed to hold the price above the 20-day EMA ($90). This shows that the bears are selling in the rallies.
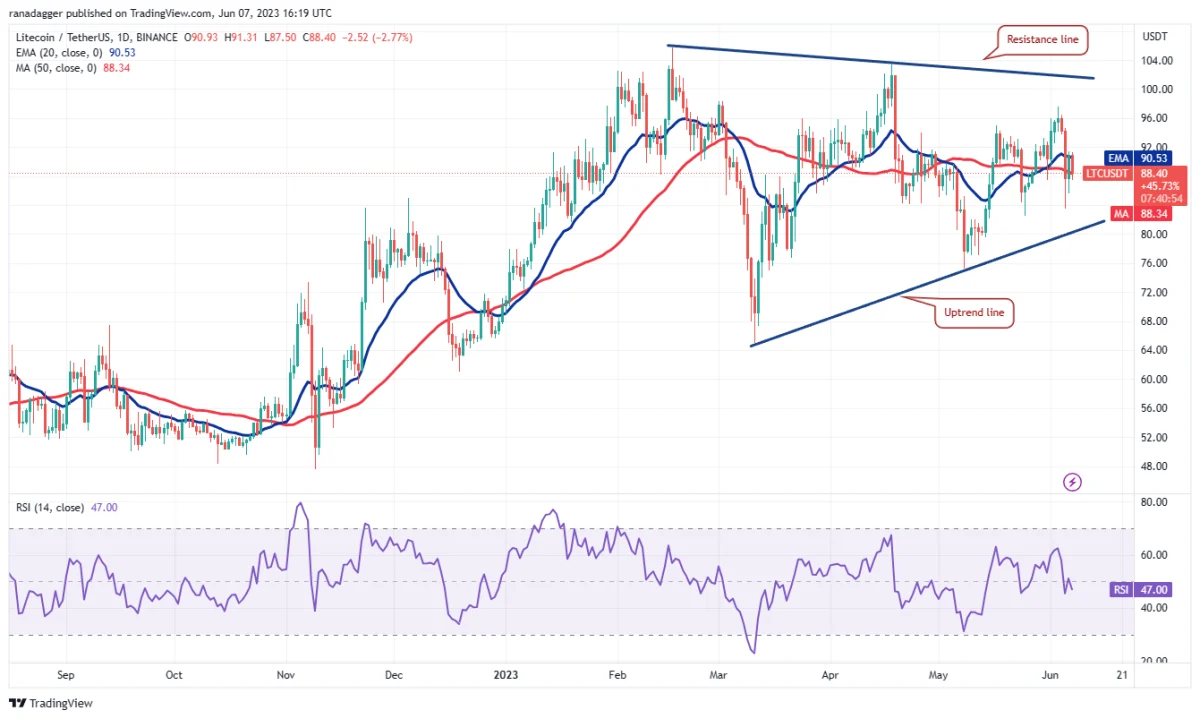
The bears will try to push the price towards the uptrend line. This is an important level for the bulls to defend. Because a break and close below this will mark the beginning of a potential downward move. LTC is likely to drop to $75 and then to $65. On the contrary, if the price turns up from the current level or the uptrend line, it will indicate that LTC will be stuck inside the triangle for a while. The bulls will need to push the price above the triangle to start the next leg of the up move.
Contact us to be instantly informed about the last minute developments. twitter‘in, Facebookin and InstagramFollow and Telegram And YouTube join our channel!
Risk Disclosure: The articles and articles on Kriptokoin.com do not constitute investment advice. Bitcoin and cryptocurrencies are high-risk assets, and you should do your own research and due diligence before investing in these currencies. You can lose some or all of your money by investing in Bitcoin and cryptocurrencies. Remember that your transfers and transactions are at your own risk and any losses that may occur are your responsibility. Cryptokoin.com does not recommend buying or selling any cryptocurrencies or digital assets, nor is Kriptokoin.com an investment advisor. For this reason, Kriptokoin.com and the authors of the articles on the site cannot be held responsible for your investment decisions. Readers should do their own research before taking any action regarding the company, assets or services in this article.
Disclaimer: Advertisements on Kriptokoin.com are carried out through third-party advertising channels. In addition, Kriptokoin.com also includes sponsored articles and press releases on its site. For this reason, advertising links directed from Kriptokoin.com are on the site completely independent of Kriptokoin.com’s approval, and visits and pop-ups directed by advertising links are the responsibility of the user. The advertisements on Kriptokoin.com and the pages directed by the links in the sponsored articles do not bind Kriptokoin.com in any way.
Warning: Citing the news content of Kriptokoin.com and quoting by giving a link is subject to the permission of Kriptokoin.com. No content on the site can be copied, reproduced or published on any platform without permission. Legal action will be taken against those who use the code, design, text, graphics and all other content of Kriptokoin.com in violation of intellectual property law and relevant legislation.