
The cryptocurrency market has always been known as a vibrant and dynamic environment, and this activity often attracts the attention of technical analysts. This time, analyst Ali Martinez spotted a bearish flag pattern on Bitcoin’s charts and warned investors of a possible decline.
Popular analyst Ali Martinez says Bitcoin is forming a classic bearish flag pattern told. The flag pattern is a pattern frequently used in technical analysis and is often seen following a strong trend. A bear flag pattern occurs when the price consolidates upward after a strong downtrend but fails to break a significant support level.
“Bitcoin appears to be forming a bear flag, a classic chart pattern that often signals a continuation of the BTC downtrend.”
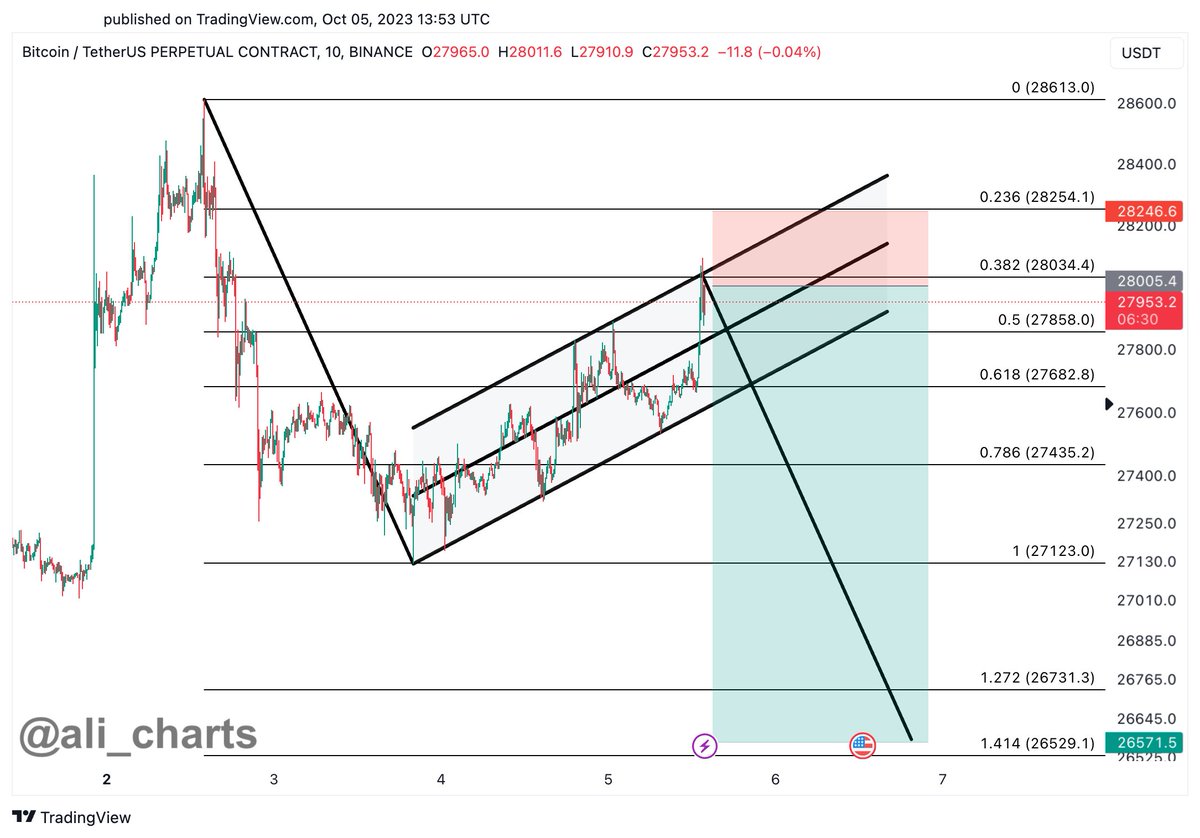
The analyst’s chart shows that if Bitcoin fails to overcome the critical resistance at $28,034, the flag pattern is highly likely to occur. This could cause BTC to drop as low as $26,751.
Martinez’s analysis is also supported by the Relative Strength Index (RSI). RSI is considered an indicator used to determine overbought and oversold levels:
“Note that every time the RSI on BTC’s four-hour chart reaches or exceeds 74.21, BTC tends to pull back. The RSI on the four-hour chart recently reached 82.83!”
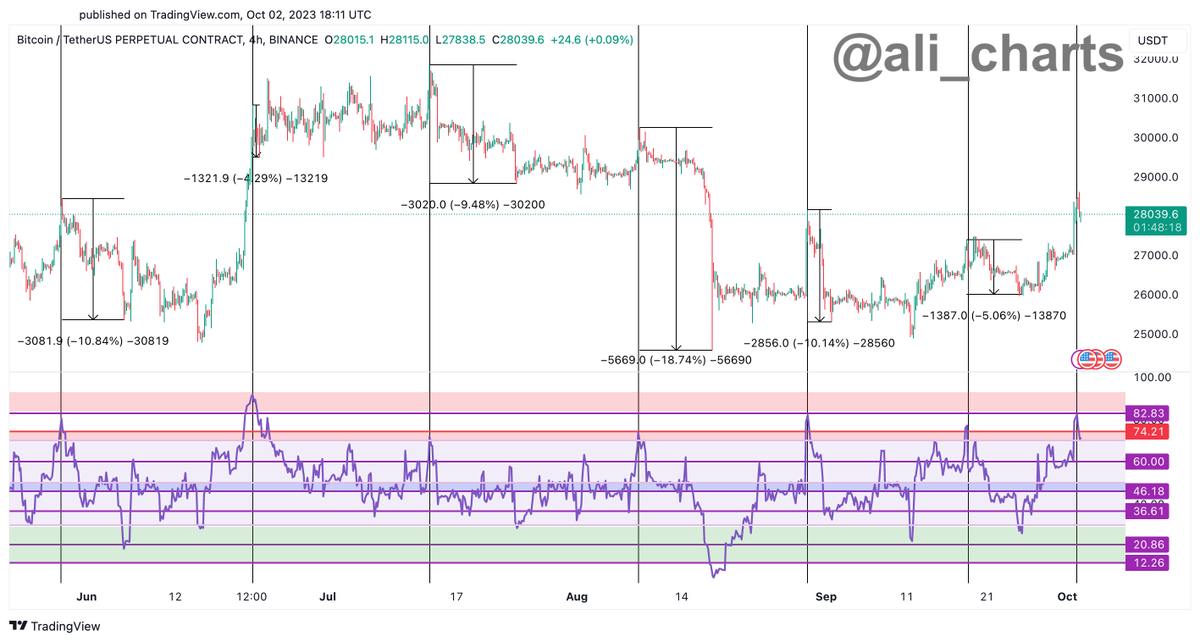
The RSI indicator scales from 0 to 100. If the RSI rises above the 70 level, the asset may be in overbought conditions, increasing the chances of a decline. A value below 30 is generally considered bullish.
Bitcoin is trading at $27,568 at press time.
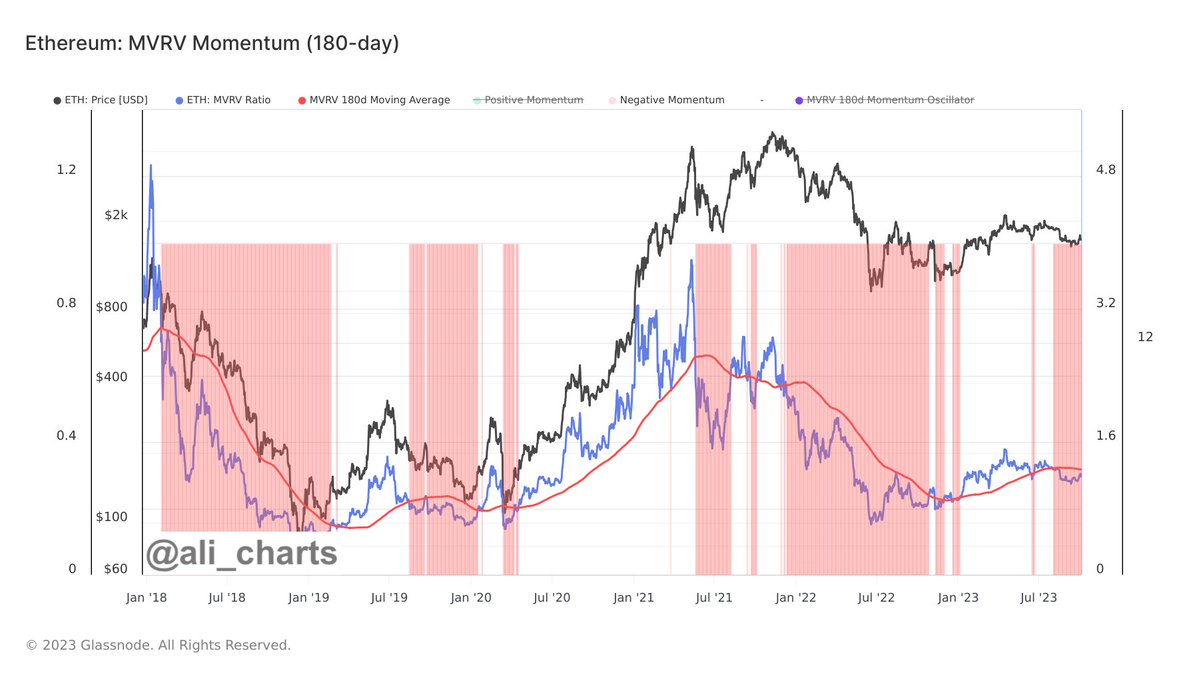
The analyst also analyzed the leading altcoin Ethereum (ETH) and said that the second-largest crypto asset by market cap is setting the stage for a return to the uptrend based on the MVRV indicator.
“MVRV (blue line) Ethereum market cycles from bearish to bullish when MVRV moves strongly above the 180-day SMA (red line). Currently, ETH is in the distribution phase and awaiting heavy accumulation!”
The Market Capitalization to Realized Value (MVRV) ratio shows the relationship between the current market value of a cryptocurrency and the sum of all past transaction prices. This ratio can be helpful in understanding whether an asset is overvalued or oversold.
ETH is trading at $1,618 at press time.
You can follow the current price movement here.