
Cardano ‘s native token, ADA, experienced a significant rise in the first quarter of 2024, with its price reaching $0.715 in March. Despite this rise, ADA has recently lost momentum, leading to a decline in value and stabilization in the price range of $0.4926 to $0.4409 during the day. According to CoinStats data, the token hit an early intraday low but later recovered slightly and stabilized above that low point.
At the time of writing, ADA is trading at $0.4625, marking a 5.75% decline in the last 24 hours. This reflects ongoing challenges for ADA as it tries to regain its previous highs. However, compared to Bitcoin, ADA has demonstrated resilience and stability, with a relative increase of 1.06%, which could provide a stronger foundation for potential future growth.
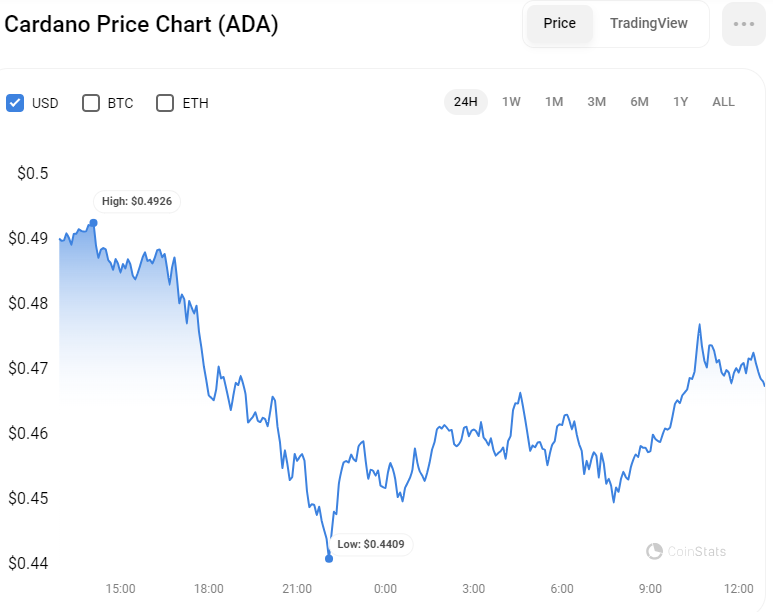
On the other hand, ADA’s market value decreased by 4.46% today, falling to 16.685 billion dollars. ADA’s trading volume also decreased by 23.13% to $647.482 million in the last 24 hours, indicating a decrease in trading activity.
In the same vein, the trading range that ADA is in serves as critical support and resistance levels. If the bearish momentum continues, ADA’s price could test the lower bound of today’s range at $0.4409. Conversely, an upward move will challenge the intraday high that acts as resistance.
ADA/USD Technical Analysis
Cardano exhibits a bearish market structure on the one-day chart, with price movement fluctuating and trending downwards since March 14. Recent developments show that after breaching a support level, ADA price stabilized in a new support range of $0.472 to $0.448. This stabilization indicates a possible consolidation phase, as the token has resisted a lower support at $0.40, which stands firm against further declines.
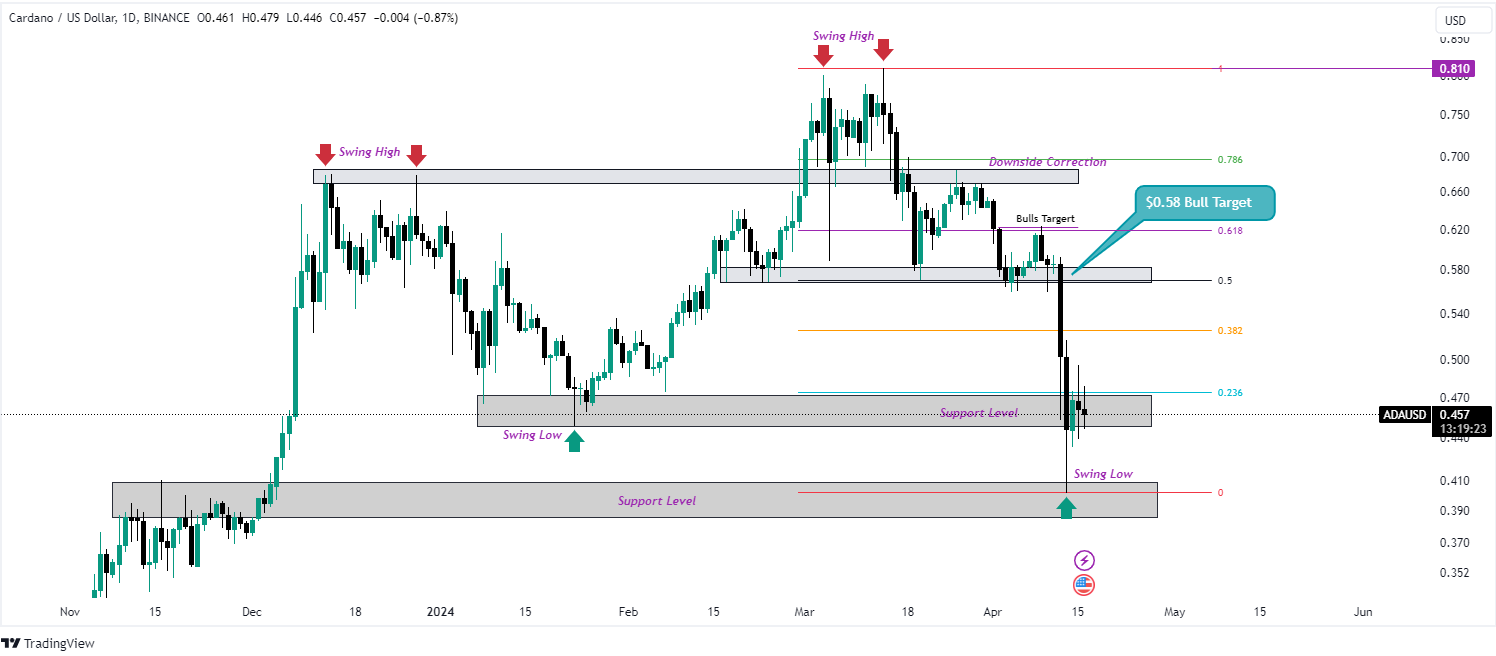
However, the market remains volatile. If the uptrend continues, ADA could potentially target the $0.58 resistance zone. This resistance is important as it coincides with the 50% Fibonacci retracement level calculated from the recent high of $0.810 to the low of $0.401. A breakout at this level could indicate a reversal of the uptrend and potentially set new targets for upside movement.
Conversely, if the price breaks below the current support level at $0.448, it could retest the $0.40 level, indicating the possibility of more downside. This bearish trend is supported by key technical indicators. The Moving Average Convergence Divergence (MACD) indicator is showing a sharp downtrend in the negative territory at 0.047, indicating strong selling pressure.
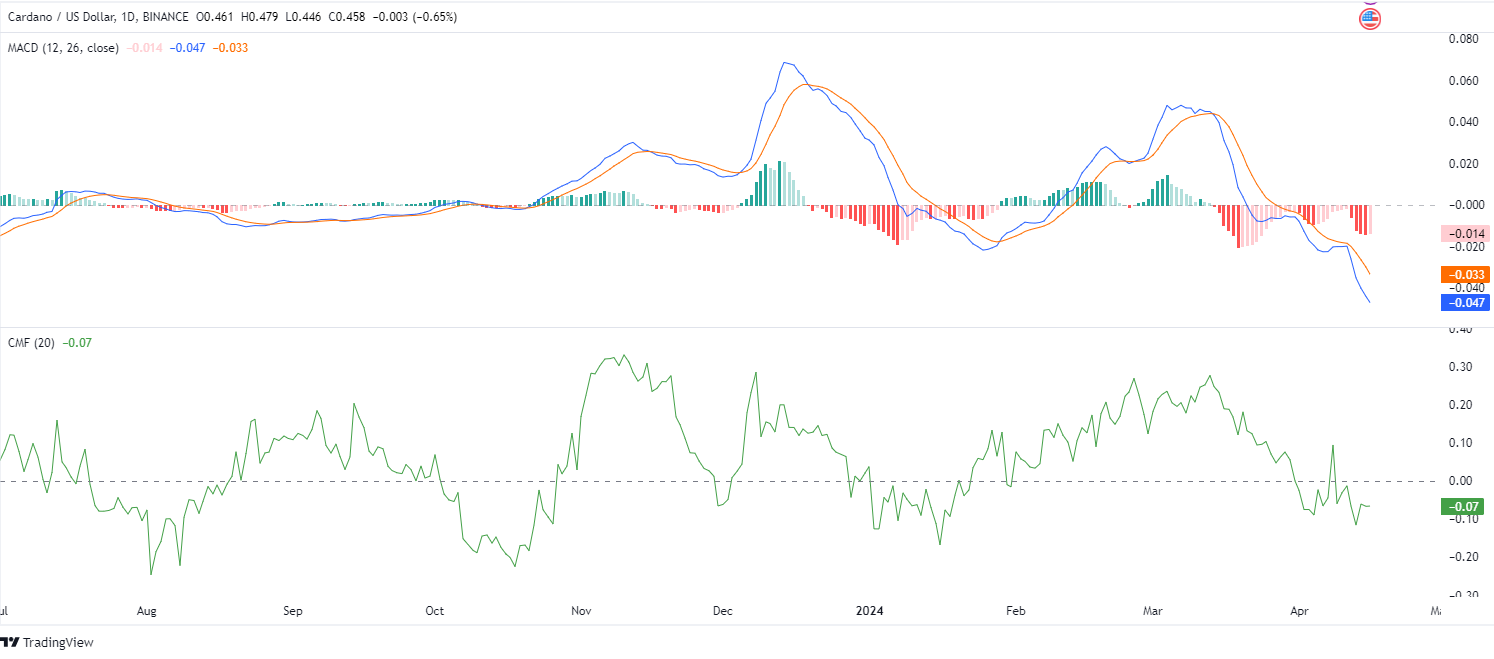
This is supported by widening red bars in the histogram below the zero line, strengthening the potential for downward trends to continue. In addition, the Chaikin Money Flow (CMF) indicator is below the zero line with a value of -0.07, indicating that money outflow from Cardano is higher than inflow, further supporting the bearish trend prevailing in the market.
