
1. Market Value (MV)
It means market value and is obtained by multiplying the total circulating supply of a coin by its market price.

2. Realized Value (RV)
“Realized Value” is the data that has emerged by considering the deficiencies of the Market value in the cryptocurrency ecosystem and the value of the transaction outputs at the last movement is taken into account.
In the table below, you will see the graph of the realized market value of Bitcoin. This value is a widely used and valued data on the onchain side, and many indicators use this data.
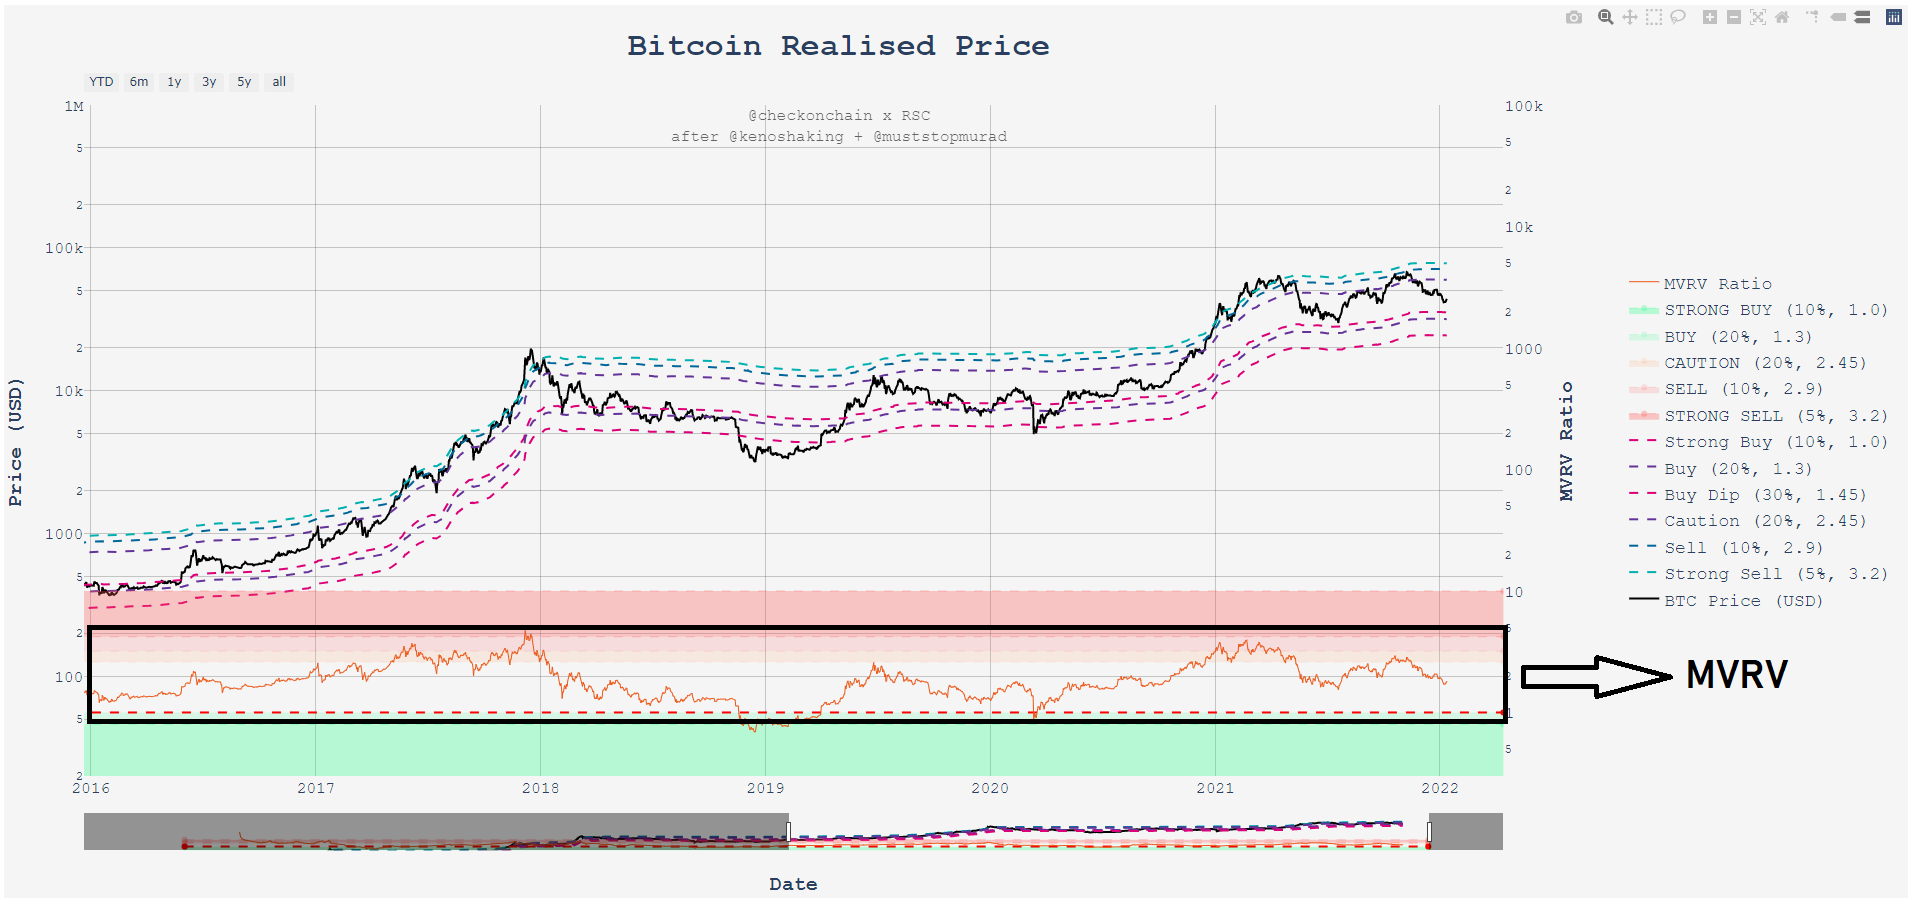
Realized value is a dataset that constantly moves according to new price movements, according to coins that have not moved for a long time.

Therefore, as in the market value calculation, it is an auxiliary indicator that guides us in terms of searching for a healthier bottom and top by taking into account less the lost, the possibility of selling, the non-moving coins.
The crypto market is constantly evolving and can be divided into different periods such as 2009-2013, 2013-2015, 2016-2019, 2019-2022.
While the first years were a product that moved with very cheap prices and high volatility, it has been supported throughout this short history by different tools such as market adaptation (futures, options markets, stablecoins, defi-nft-metaverse…).
The last period, on the other hand, can be defined as a more mature period, which is influenced by macro markets and increased institutionalization.
Therefore, we must take these transformations into account in our future projections.
As you can see from the table above for 2016-2019; We see price movements moving in a certain plane. Therefore, I find it useful to concentrate on this part.
By looking at the probability histograms of the MVRV rate between 2016-2019 in the table below, we can see where the price is concentrated on the MVRV graph and with what % probability it visits these regions.
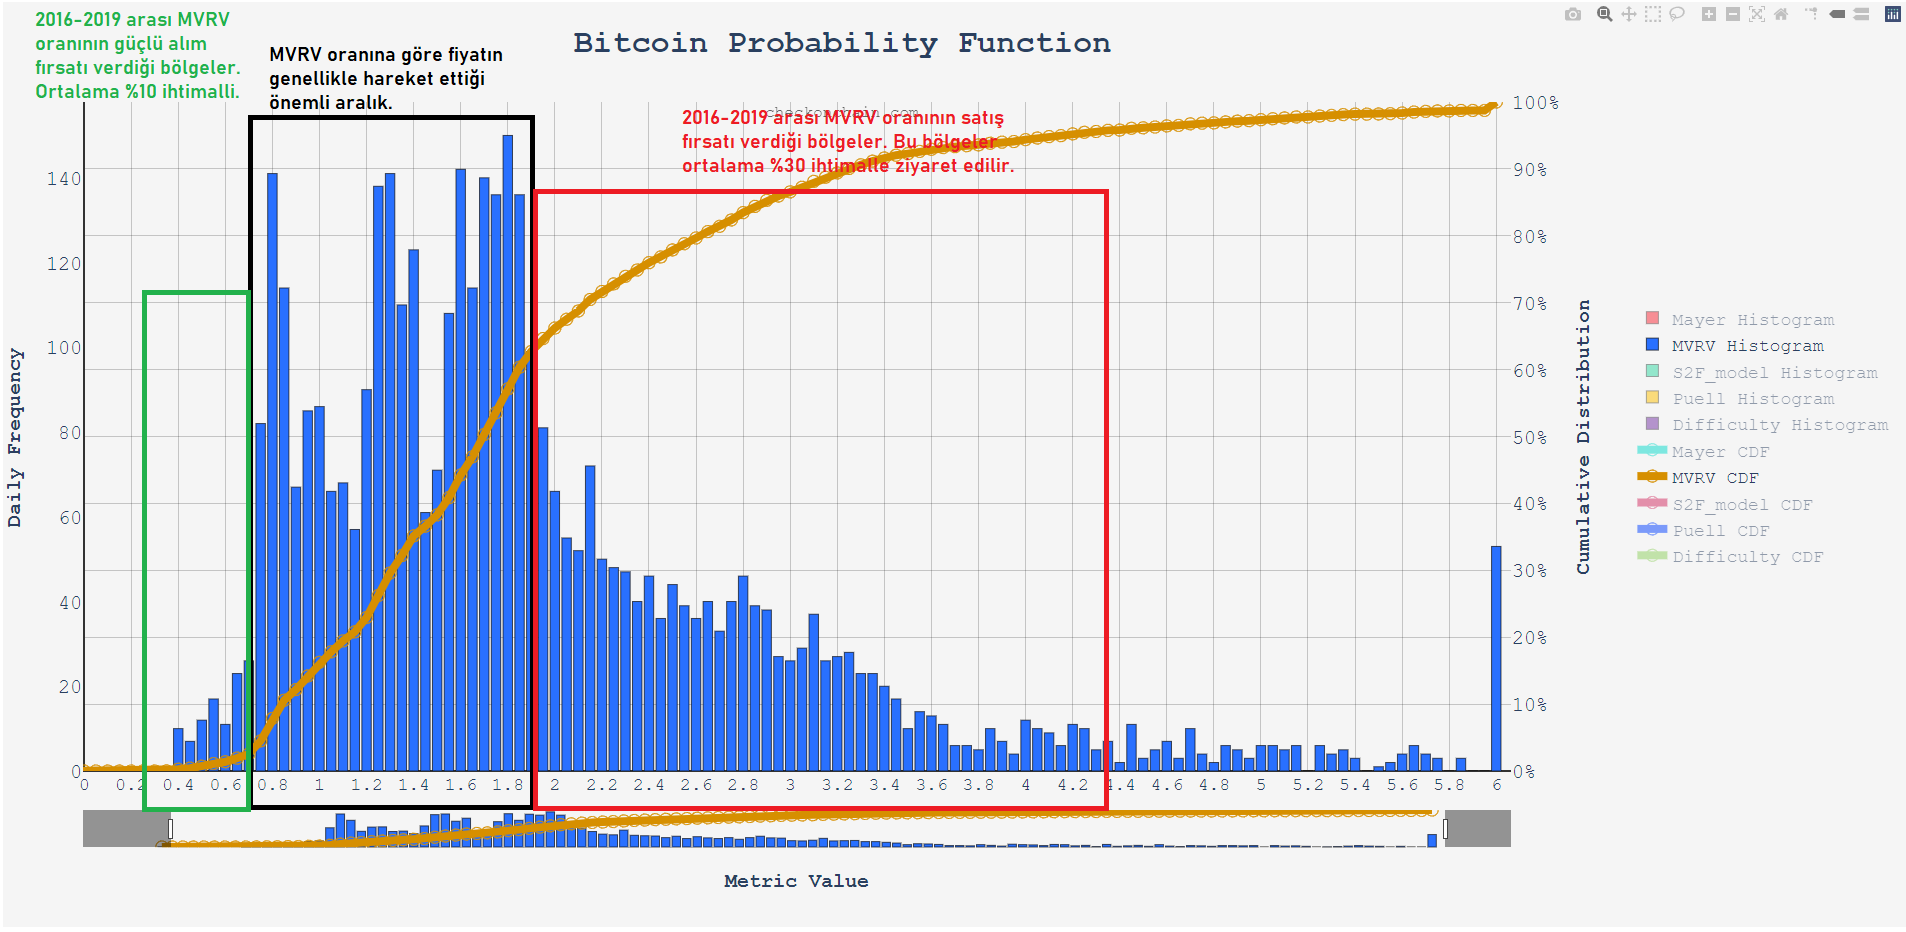
Now, according to that table, let’s look at the MVRV rate between 2016-2019 and the bottoms and peaks it shows us from the table below.
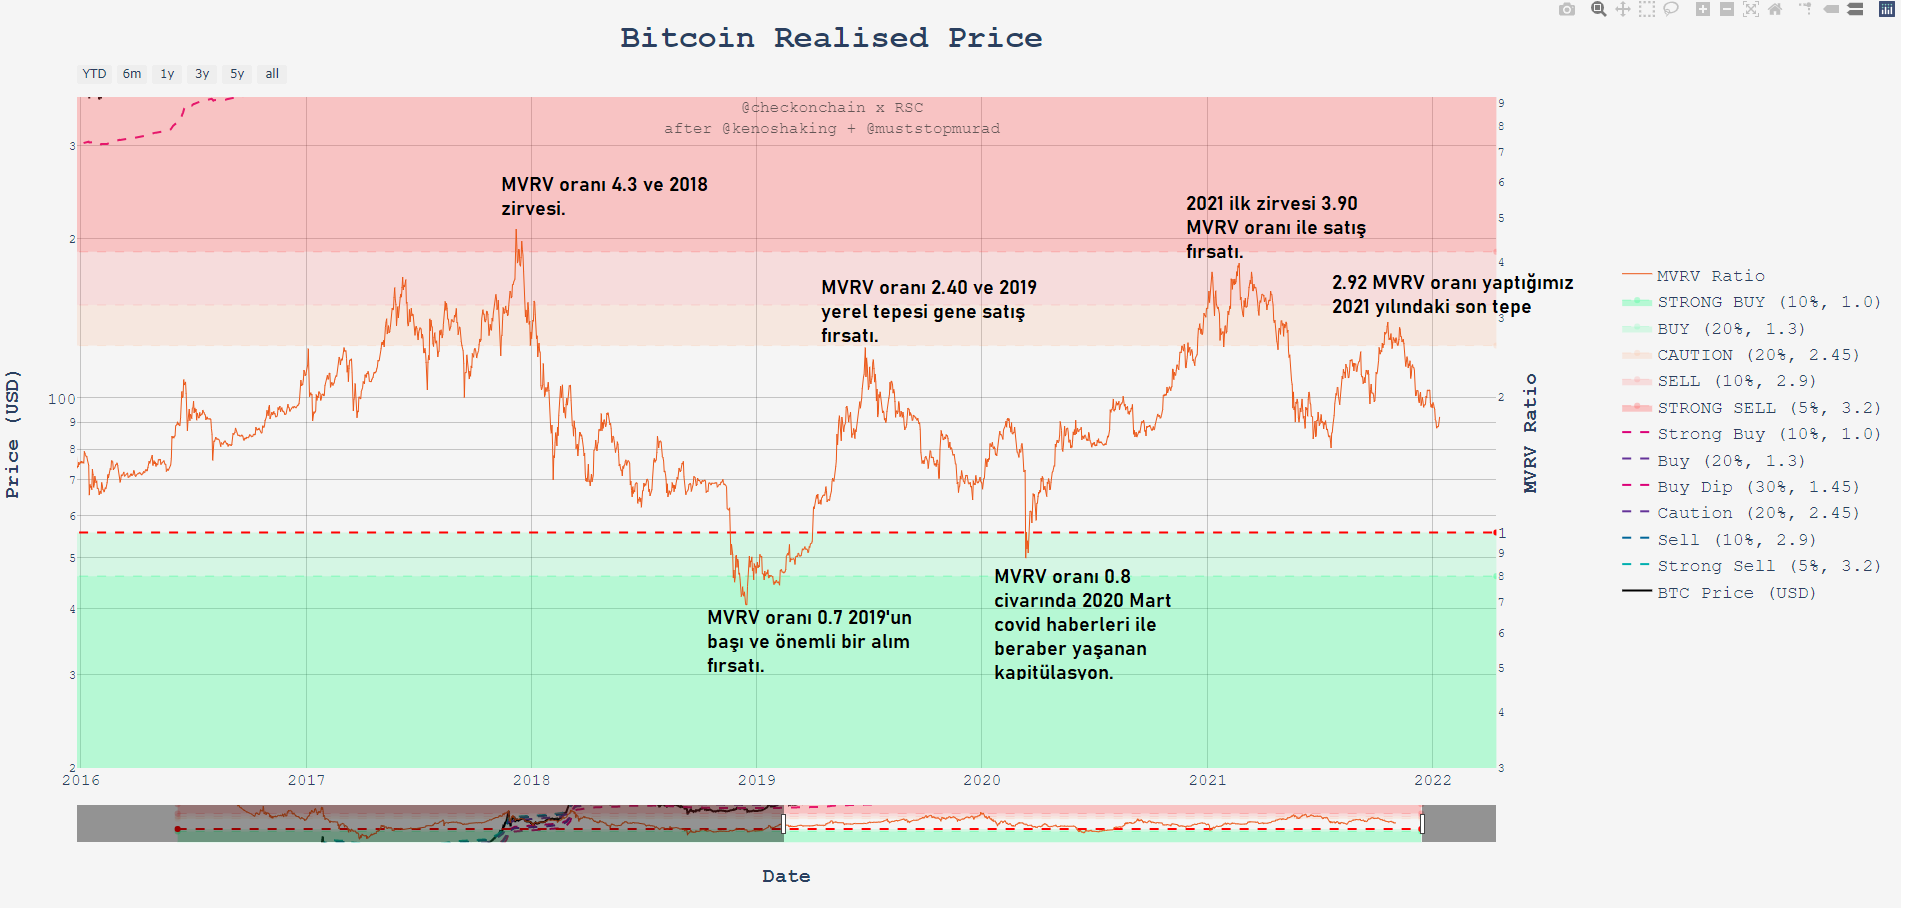
Examining the charts above and combining them with probability histograms, we can see important buy and sell regions that are very valuable and make sense for long-term investors.
Again, we can determine long-term price ranges for ourselves with probability calculations.
Now that we understand the past, let’s look ahead;
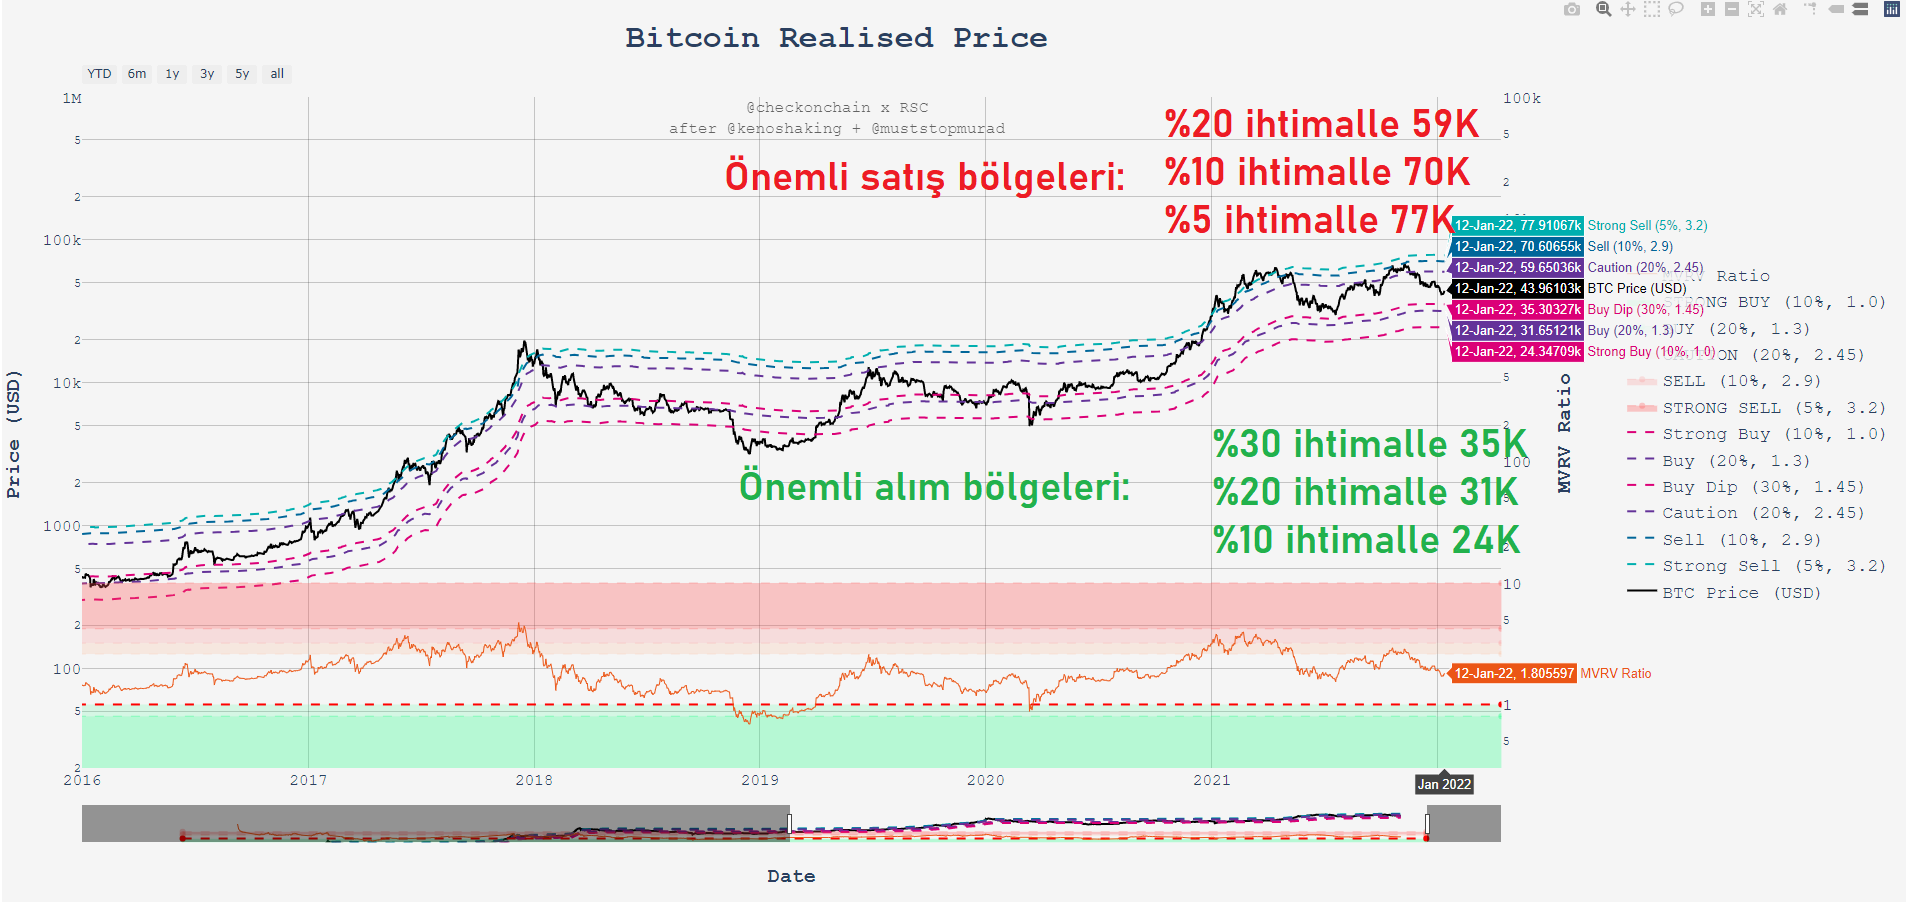
When we look at it from a long-term perspective, we can see valuable buying regions and valuable sales regions in the coming periods.
Considering that we are currently in a downtrend, we should not forget that the highest probability appears at the level of 30 to 35K.
Likewise, it should be kept in mind that investors who can make purchases from these valuable regions realize or have the opportunity to realize their investments from very profitable figures in the long term.
The most important thing for an investor, especially for a long-term investor, is to wait patiently for the right levels, by establishing the portfolio balance correctly.
It means not to head the trend, to always have cash in your pocket, not to focus on one region and to choose the right strategy for each scenario.
Ultimately, it is knowing that no account will yield 100% results.