
Bitcoin remains locked in a battle near the $69,000 level for several days. Will Bitcoin’s current consolidation unravel to the downside or the upside? Has the correction in certain altcoins including SHIB Coin ended? Crypto analyst Rakesh Upadhyay examines the charts of the top 10 cryptocurrencies to find out.
BTC, ETH, BNB, SOL and XRP Coin analysis
Bitcoin (BTC) price analysis
Bitcoin formed a symmetrical triangle formation, indicating a balance between buyers and sellers. In general, the symmetrical triangle acts as a continuation formation. However, sometimes it is possible for it to act as a reversal formation. The flat 20-day EMA ($67,750) and RSI near the midpoint do not give a clear advantage to bulls or bears. If the price falls and breaks below the triangle, it will indicate the beginning of a deeper correction. BTC is likely to drop towards $60,000 and eventually the 61.8% Fibonacci retracement level of $54,298. Conversely, if the price rises and breaks above the triangle, it will indicate that the bulls are absorbing supply. This will increase the possibility of a resumption of the bull trend. In this case, it is possible for BTC to rise to $73,777 and then to $80,000.
Ethereum (ETH) price analysis
ETH has been trading below the 50-day SMA ($3,434) for the last three days. This indicates a lack of aggressive demand at these levels. The moving averages are about to complete their downtrend and the RSI is in the negative territory. This shows that sellers have an advantage. Strong support lies at $3,056. However, if this level is exceeded, it is possible for ETH to drop to $2,700. Instead, if the price recovers strongly from the $3,056 low, it will signal aggressive buying on dips. It is possible for ETH to consolidate between $3,056 and $3,678 for a few days. A break above $3,678 will indicate that the bulls are back in the game.

Binance Coin (BNB) price analysis
BNB’s price action over the past few days has formed a symmetrical triangle formation, indicating indecision between bulls and bears. It is difficult to predict the direction of a breakout from a triangle. Therefore, it is best to wait for the breakout to occur before creating large positions. If the price bounces off the 20-day EMA ($565) and moves above the triangle, it will signal the resumption of the uptrend. BNB is likely to rise to $692 and then to the $795 formation target. Conversely, if the price slides below the triangle, the advantage shifts in favor of the bears. In this case, it is possible that BNB will drop to $460. If it breaks down to this level, the next stop will likely be the $395 formation target.

Solana (SOL) price analysis
SOL broke below the 20-day EMA ($181) on April 5. Thus, it showed that short-term investors were booking profits. SOL is likely to fall to the strong support at $62. If the price recovers strongly from this level and moves above the 20-day EMA, it will indicate that SOL will remain in the $162 to $205 range for a while. Conversely, if the price continues to decline and breaks below $162, SOL will complete the bearish double top formation. There is minor support at the 50-day SMA ($152). However, it is likely to break this. It is possible for SOL to drop as low as $126 later.

Ripple (XRP) price analysis
XRP fell below the uptrend line on April 3. This indicated that the bears successfully defended the level on April 4, selling on every small rally. The falling 20-day EMA ($0.61) and the RSI in the negative zone show that sellers are gaining an advantage. If the price falls below $0.56, XRP is likely to drop to $0.52 and then to $0.48. If the bulls want to make a comeback, they will need to quickly push the price above the 20-day EMA. It is possible that this will pave the way for a possible rally to $0.69. This level will again act as a strong barrier. However, if the bulls overcome it, XRP is likely to reach $0.74.

DOGE, ADA, AVAX, TON and SHIB Coin analysis
Dogecoin (DOGE) price analysis
DOGE broke below the 20-day EMA ($0.18) on April 3. Additionally, the bears thwarted the bulls’ attempts to push the price back above the level on April 4. Sellers will try to extend their advantage and pull the price back towards the 50-day SMA ($0.15). This is an important level to pay attention to. Because a break below could open the doors for a further decline to $0.12. Taurus have their hands full. If they want to regain the upper hand, they will need to quickly push the price above $0.19. If they do so, DOGE is likely to rise to the overhead resistance of $0.23.

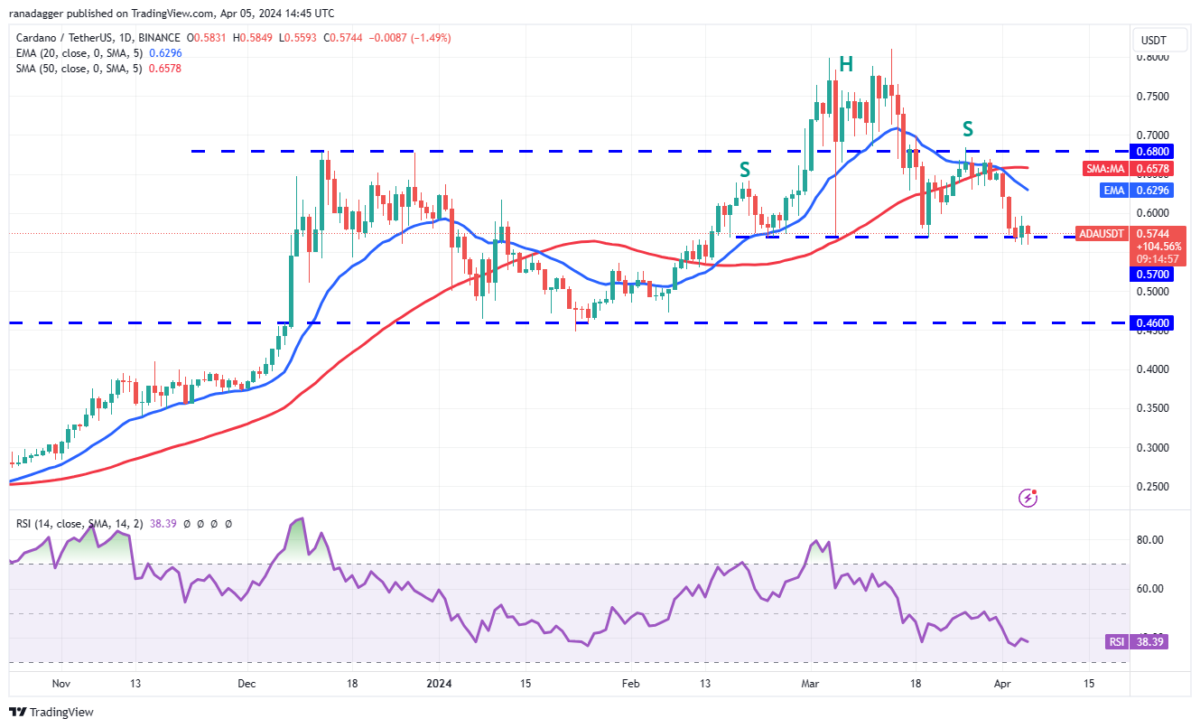
Cardano (ADA) price analysis
The bulls are having a hard time defending the $0.57 level on Cardano. This indicates a lack of demand at current levels. If the price declines below $0.57, it will complete a bearish head and shoulders formation. The target target of this negative formation is $0.33. However, the bulls will try to stop the decline with the strong support at $0.46. Alternatively, if the price turns up from $0.57, it will provide a solid buy signal at lower levels. ADA will then attempt to rise to $0.68, where the bears are expected to mount a strong defense.
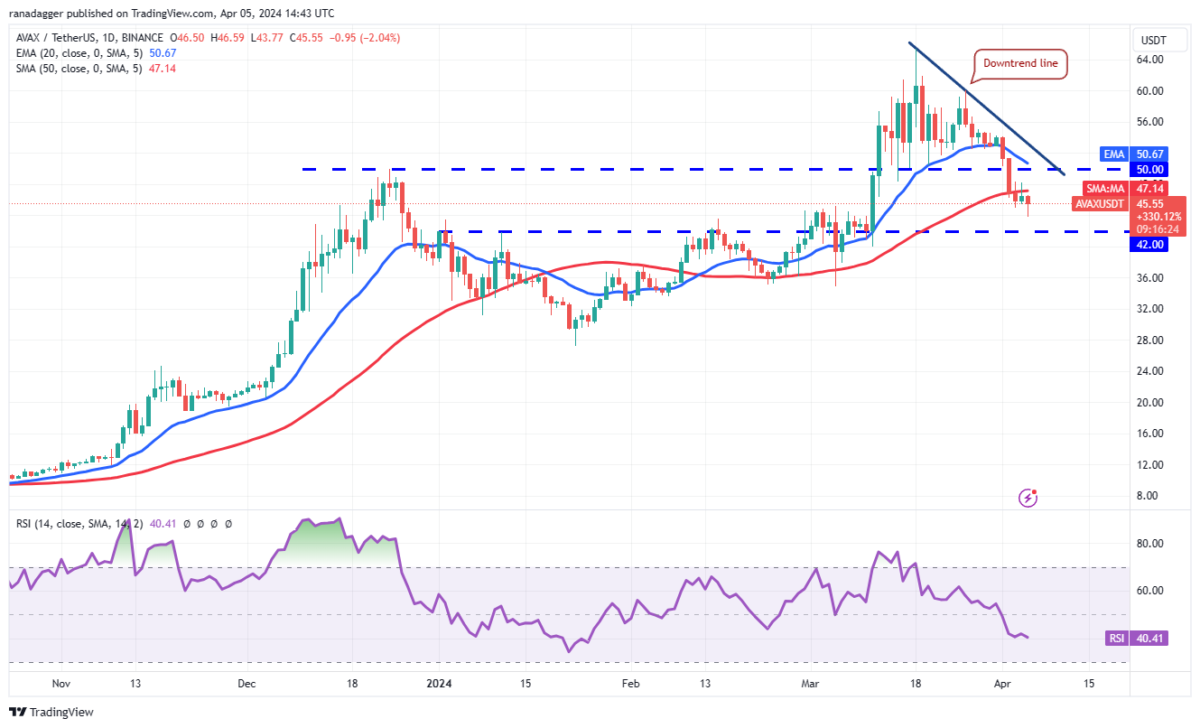
Avalanche (AVAX) price analysis
cryptokoin.comAs you follow from , AVAX fell below the 50-day SMA ($47) on April 3. Thus, it showed that the bears were in control. The bulls attempted to push the price back above the 50-day SMA on April 4. However, it failed. This increases the possibility of the price falling to $42. This is an important support and the bulls are likely to defend it strongly. Any recovery is likely to again be met with selling in the moving averages. Buyers will have to push and hold the price above the downtrend line to indicate that the correction may be over. It is possible that AVAX may then try to rise to $60 and then to $65.
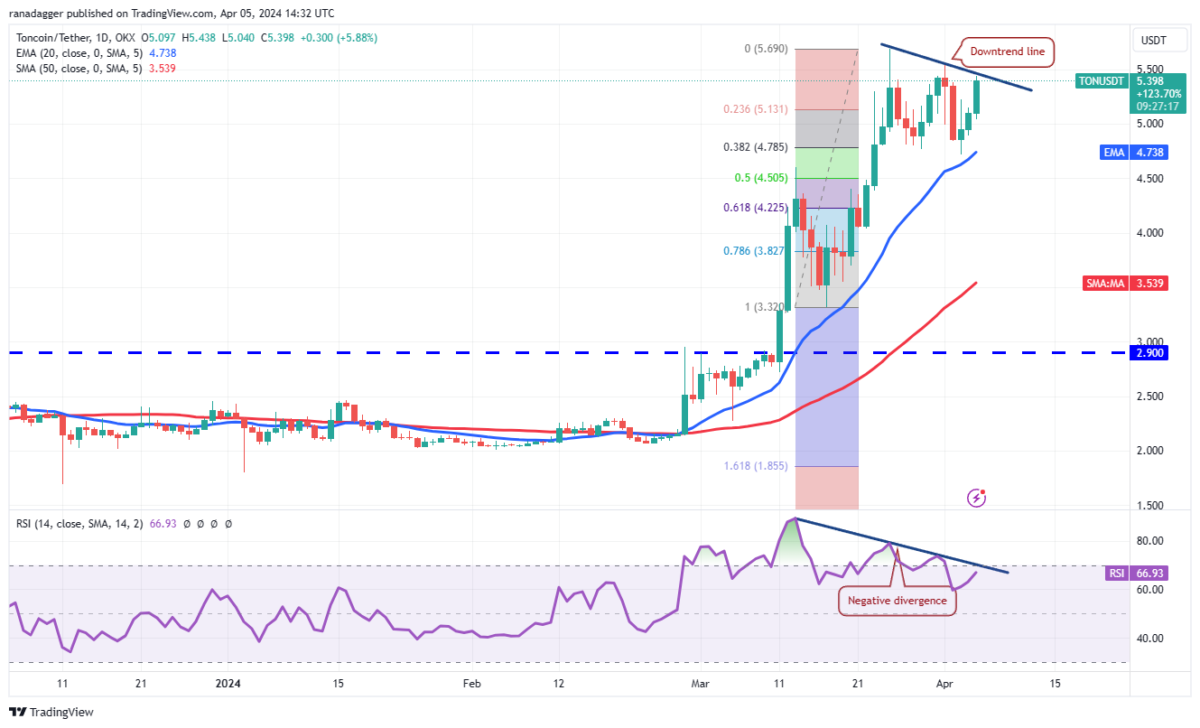
Toncoin (TON) price analysis
Toncoin (TON) bounced off the 20-day EMA ($4.73) on April 3. This has reached the bear trend line, which is a very important level to pay attention to. If the bulls push the price above the monthly trend line, this will indicate that the correction has ended. TON is likely to retest the $5.69 resistance. The bears are expected to defend this level fiercely. Because if they fail in their efforts, it is possible for TON to skyrocket towards $7.09. Contrary to this assumption, if the price declines sharply from $5.69, it would indicate that the bears are active at higher levels. This is likely to keep TON between $5.69 and $4.72 for a while.
Shiba Inu (SHIB Coin) price analysis
Bulls are attempting to push SHIB Coin price above the 20-day EMA ($0.000028). But the bears do not agree to this. The flat 20-day EMA and RSI near the midpoint do not give a clear advantage to bulls or bears. A breakout and close below the 50-day SMA ($0.000024) could accelerate selling. It is possible that this could drop the SHIB Coin price to $0.000017. On the upside, the bulls will need to push and sustain SHIB Coin price above the bearish trend line to suggest that the corrective phase may be over. SHIB Coin price is likely to rise to $0.000033 and then to the stiff overhead resistance of $0.000039.

To be informed about the latest developments, follow us twitter‘in, Facebookin and InstagramFollow on and Telegram And YouTube Join our channel!