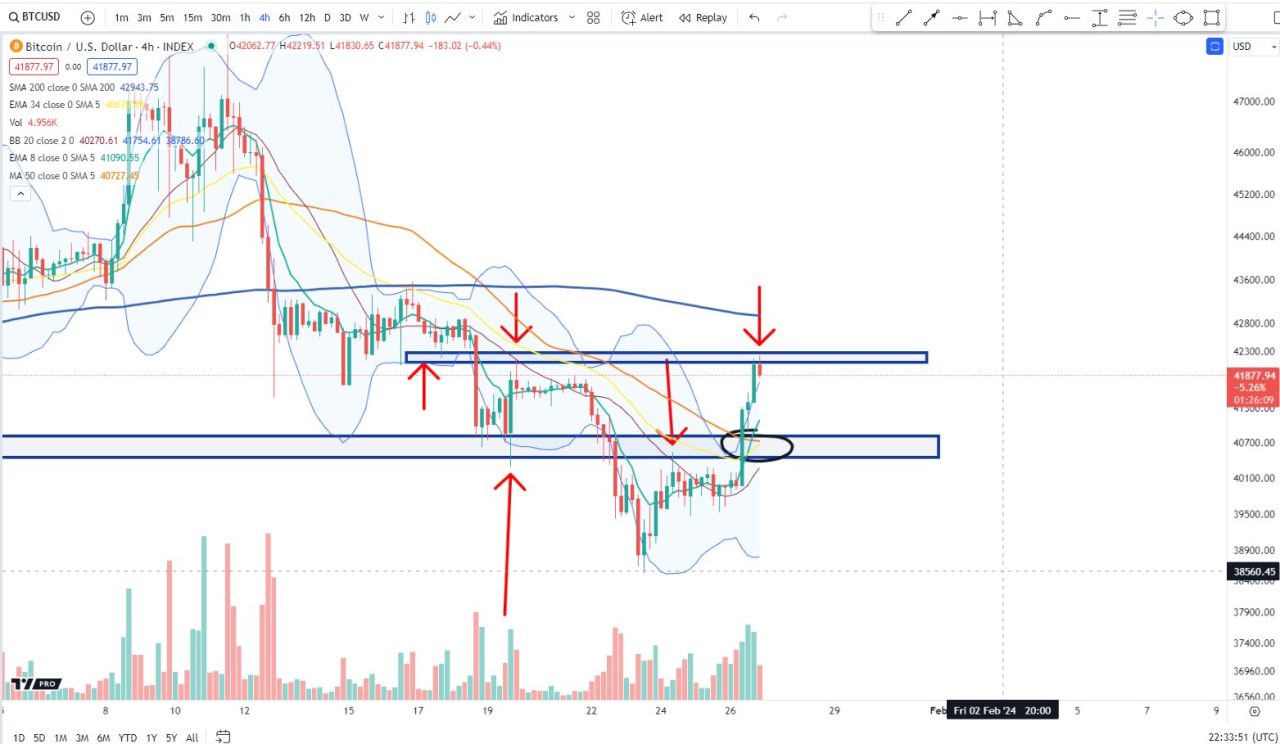
Analyst Cheds, an influential name in the cryptocurrency markets, evaluated a promising bullish scenario for Bitcoin (BTC). With Bitcoin falling below $40,000 last week, Cheds suggested that a move above the $40,500 level could create new bullish momentum for the cryptocurrency. lasted. According to the analyst, if this level is exceeded, BTC may excite investors by giving a positive signal.
Another noteworthy element in Cheds’ analysis is the view that Bitcoin could potentially form an inverse head and shoulders pattern (I-HNS). The analyst suggested that if $40,500 becomes a new support point or acts as the right shoulder, Bitcoin could enter a new uptrend. “We will watch the current situation of BTC and see whether there will be a comeback or a breakout. Perhaps inverted head and shoulders (I-HNS) may occur.” said.
Inverse Head and Shoulders is one of the price chart patterns in technical analysis and is usually a pattern that indicates that a downtrend in an asset has ended and an uptrend may begin. This pattern refers to a specific pattern seen on charts drawn to represent the price movements of an asset:
- Left Shoulder: During this phase, prices usually trend downward and reach a bottom. Prices then rise, but usually do not quite reach the old peak.
- Head: This phase, which comes after the left shoulder, usually represents a deeper decline. Prices then rise, but do not exceed the left shoulder level.
- Right Shoulder: This phase, which follows the head, represents a period in which prices rise again and approach the left shoulder level. However, it usually does not exceed the level of the left shoulder and forms a resistance point.
Looking at the analyst’s chart, he seems to be predicting that Bitcoin will break out of the formation if BTC manages to surpass the resistance around $42,300.
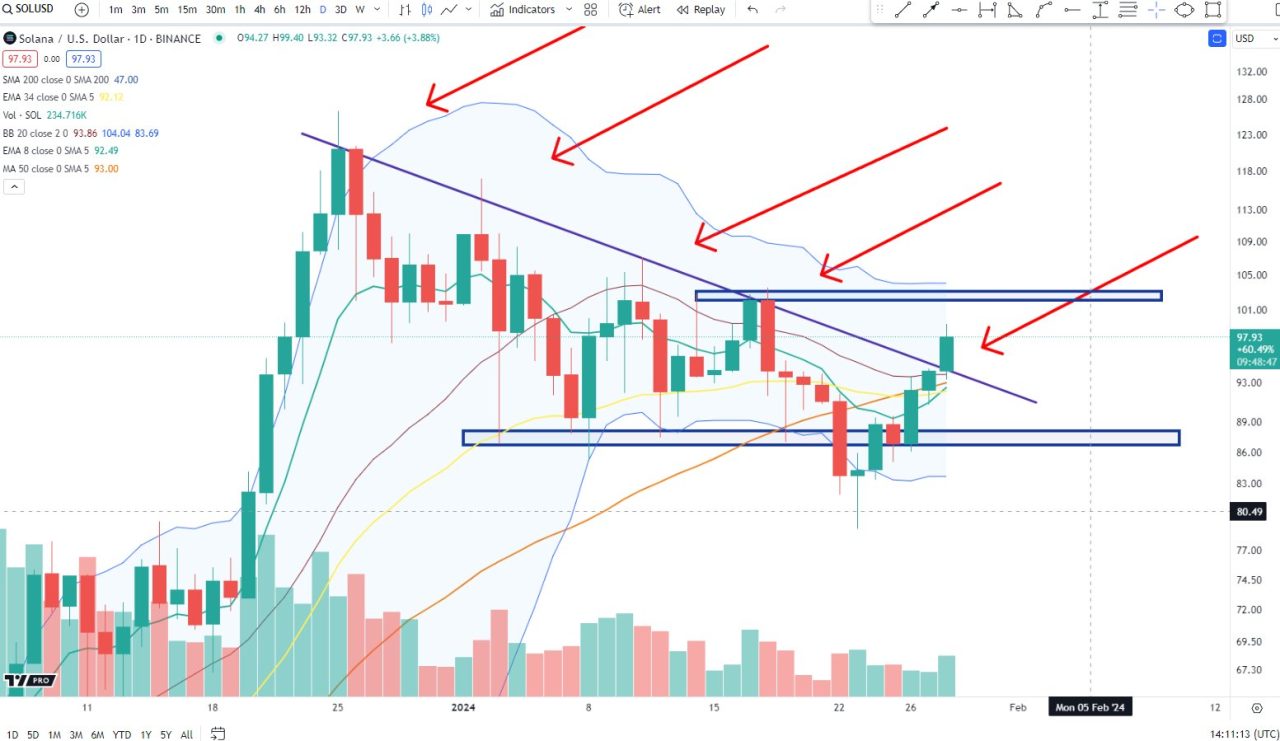
The crypto strategist is also closely monitoring the price action of popular altcoin Solana (SOL). The analyst shares a chart that suggests Solana has eliminated short-term crossover resistance. However, the trader emphasizes that SOL must turn its next resistance into support to confirm a breakout.
“SOL update. Turning $103 resistance into support, [kırılmayı] “It will confirm.”
You can follow the current price movement here.