First of all, I would like to briefly explain the indicator without being too boring; This metric consists of 2 different onchain metrics; Liveliness and Realized Price.
Realized price-to-liveness ratio; It compares long-term investors’ spending/HODL behavior (liveliness) with Bitcoin’s fair value (Realized Price).
If more coin days are destroyed (CDD), these long-term HODLers mean that investors are taking action and tending to sell, thus increasing Liveliness.
The rise of Liveliness also tells us that the Realized Price is moving lower, so we think of long-term investors as seeing the fair value of Bitcoin lower. So for the positive scenario, we need CDD to be low, Liveliness to move down, and fair value to move up.
So, what does it mean for the Realized Price to rise? More coins are buying at higher levels and the cost base is rising, which means higher demand. During these periods, long-term investors turn to sell and we see high CDD values, which increases Liveliness. It moves up at Realized price-to-liveliness ratio. This is how bull periods happen.
What can this metric provide us;
- Ability to show macro transformations (Bear-Bull).
- Ability to show support-resistance points at macro level.
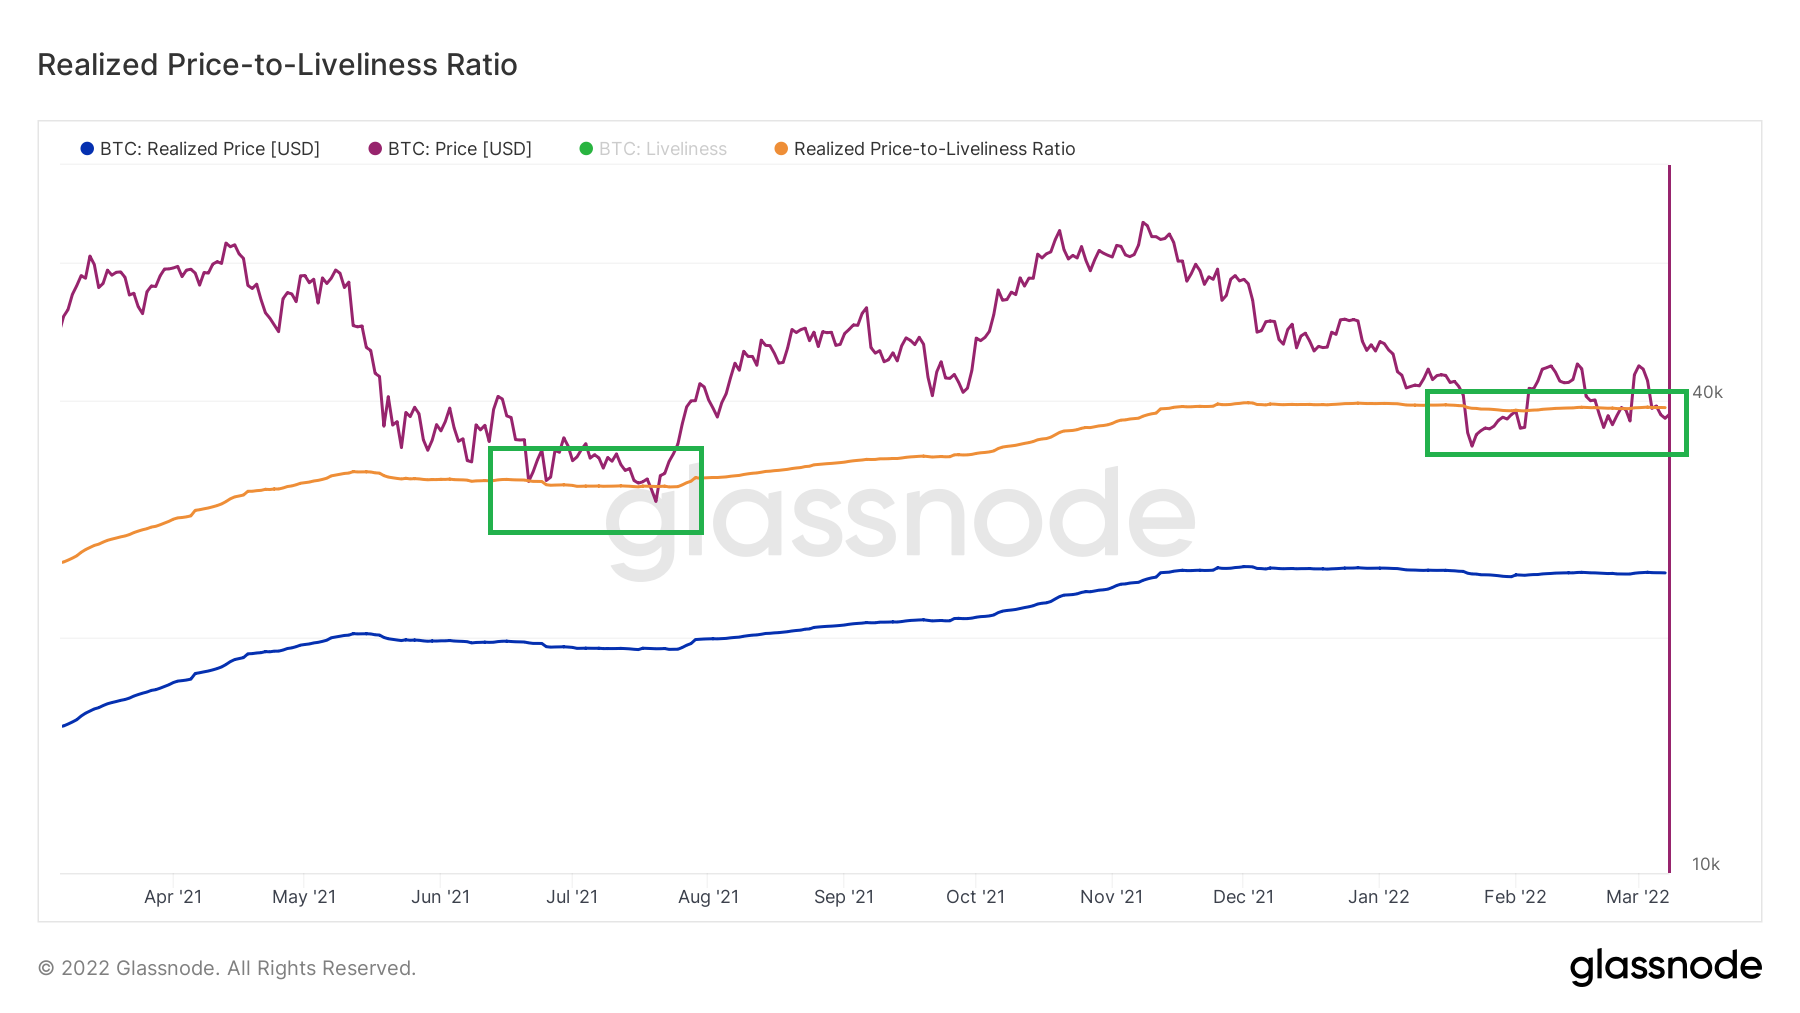
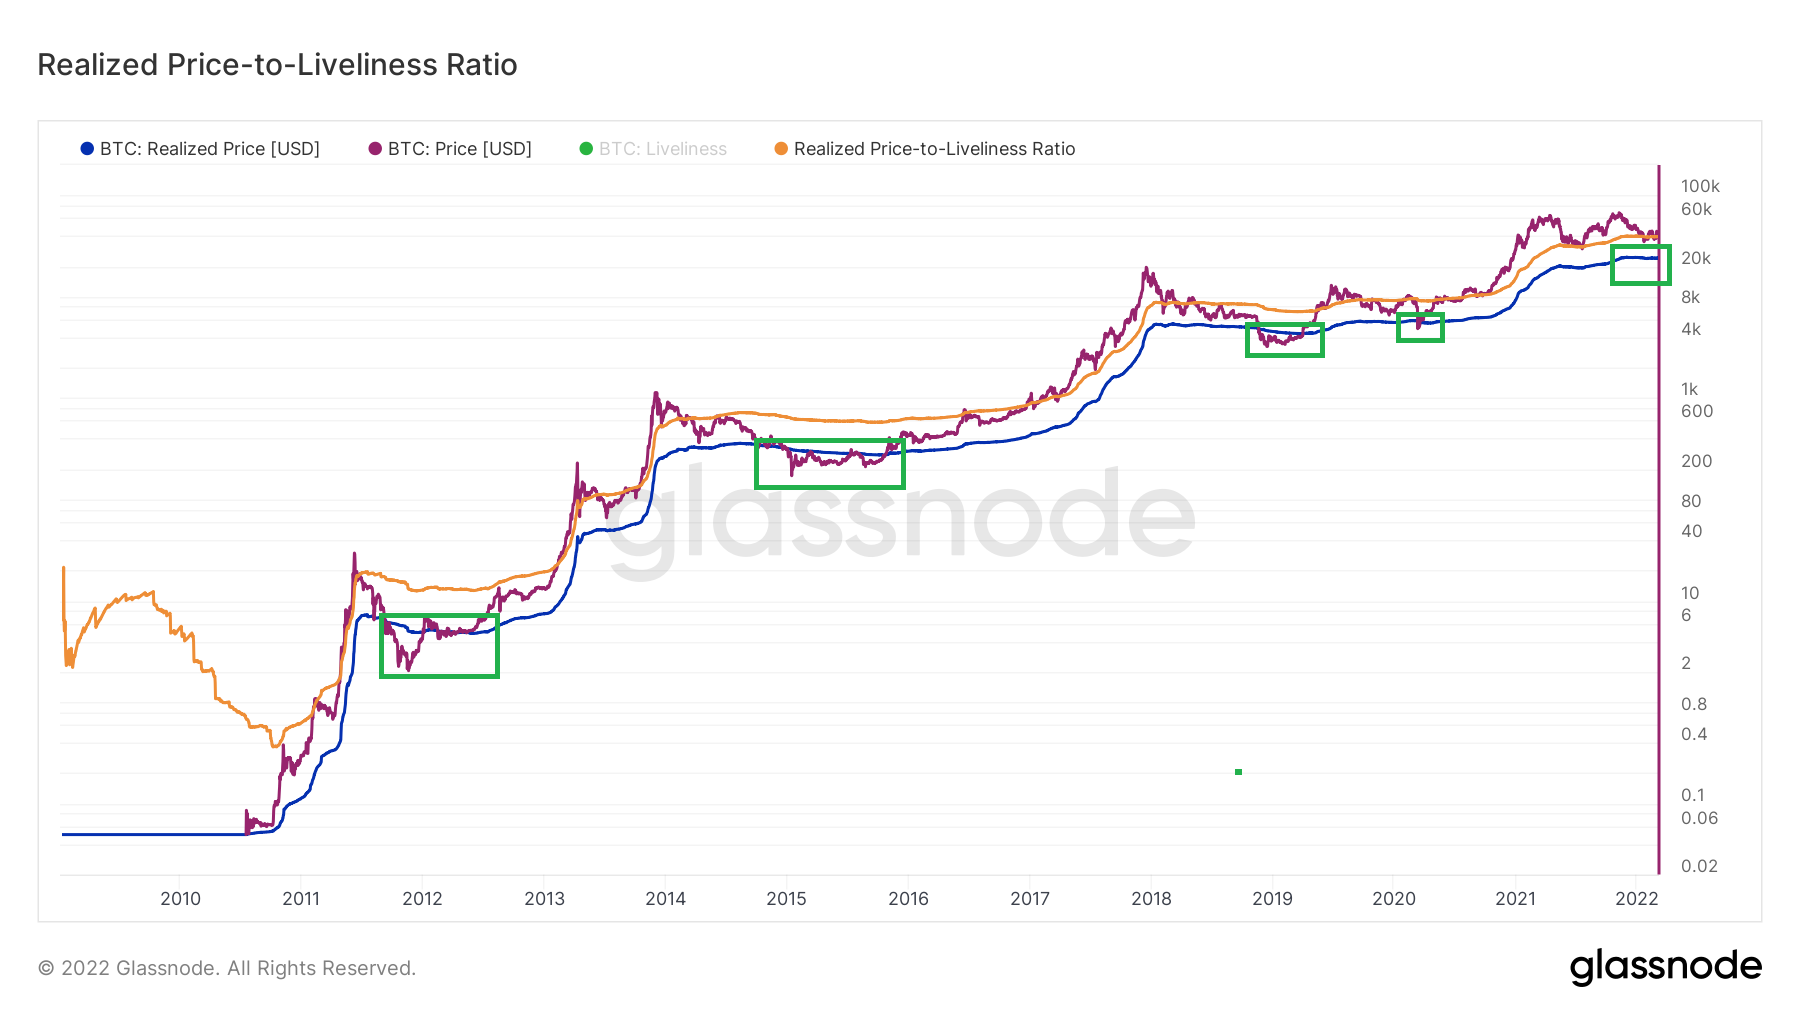
Let’s take a closer look at the metric above. Dark yellow line Realized “Price-to-Liveliness Ratio”; When the price starts to move above the metric, we see that both the lower blue metric, Realized Price, rises, and the bullish period continues as long as the price continues its movement above the dark yellow line. In this sense, the fact that the price is above the dark yellow line shows us important signs.
What’s the Table Today?

Long-term investors do not sell, they think the fair price is not lower at the moment, but they are also aware of the low demand so they are not willing to sell and see the most logical way to continue the HODL behavior.
As you can see in 2021, this metric has never been dropped. It continues to work very nicely as support and resistance.
But will it fall, yes it can, but if it falls, where will it be seen?

When we look at the past, we can see that the hardest point of the bear periods was the Realized Price after the dark-yellow line was broken. BTC that did not go out of this zone, except for short-term violations. This line is now Around 24K.
I think that this is the bottom zone that can be experienced during a possible capitulation, panic sale, for now, of course, this line may move down as a result of the change in the above-mentioned investor behavior over time, but for now, it has been stable for a very long time and maintains its formation.
The area that the Realized Price-to-Liveliness ratio metric shows us is in the 39.2K region. It is possible for this to work as a resistance for the time being because the price is currently below this zone. We can accept short-term violations in this region, as the price has been hovering around the dark yellow line for the last 3 months, but it has neither been able to break up nor go down.
