
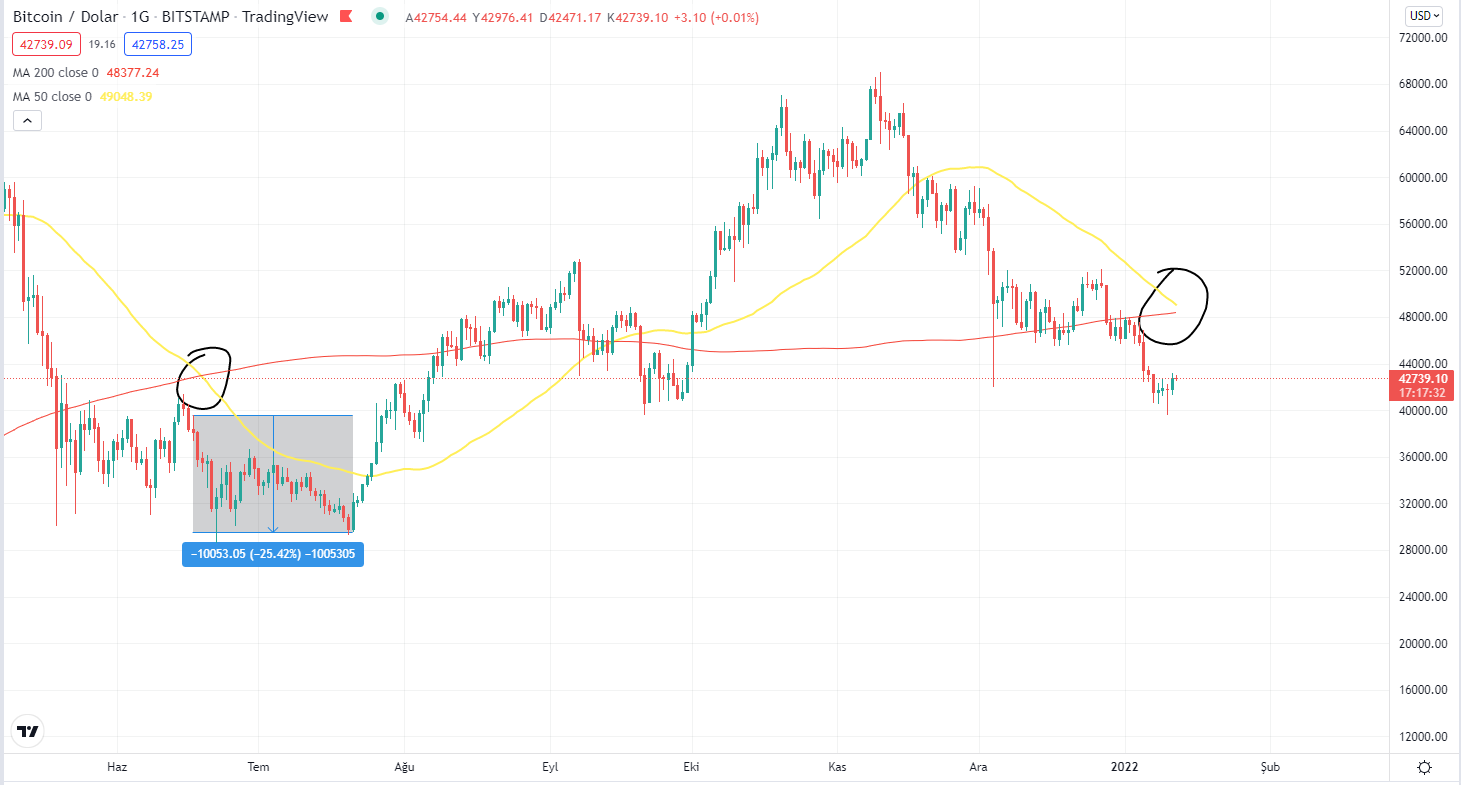
Right after the “Death Cross”, which coincided with the last time of the decline that started in May 2021, the bitcoin price dropped by 25% to 29,500.
50 days moving average, 200 days Death Cross, which is called the falling below by cutting the moving average from the top to the bottom, states that there will be a decrease in the market, although it is not certain.
Last 19 June 2021 The market after the Death Cross in after 25% off Then it started to recover.
in March 2020 While the actual Death Cross price almost does not affect, in October 2019 Bitcoin price rose at the Death Cross, which took place.
Research by Kraken exchange, 2014 and 2018 It revealed that the Death Crosses seen in the previous year or the next day had high volume sales.
Bitcoin, which started the first weeks of the new year with a decline, exhibits volatile price movements with the FED statements.
Fed Chairman Powell, who made a statement yesterday, stated that he would complete his asset purchases in March.
Fed Chairman Powell, saying that it is highly likely that interest rates will remain at low levels, announced that they would raise more interest rates if necessary. Although the market has recovered somewhat with these statements, it remains uneasy.