
The strategist Kevin Svenson, who is closely followed in the crypto money market, bitcoin He stated that the price is ready for a parabolic fluctuation. Svenson shared the details, stating that an uptrend has emerged on the daily chart.
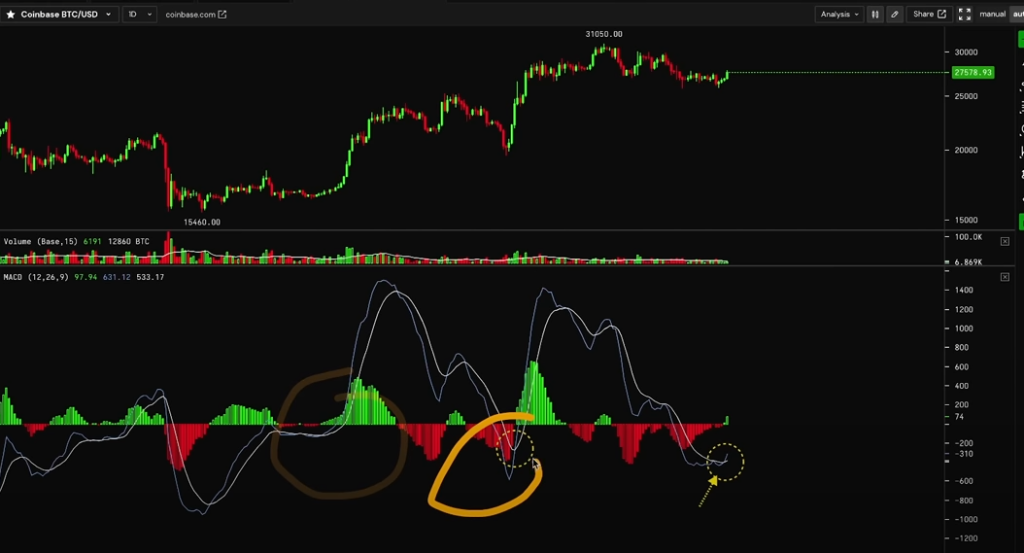
Kevin SvensonHe noted that the Bitcoin MACD indicator forms an intersection on the daily chart. The MACD is a momentum indicator that traders use to monitor possible trend reversals.
According to the strategist, there has been a strong rally in the last two times the MACD has been bullish on the daily chart.
These daily MACD crossovers can sometimes be just the beginning of a much larger move. We saw this in early March with a 45% pump right after our daily MACD crossover and when we crossed earlier this year. We went from about $16,000 to over $20,000, $23,000 and $24,000.
NEWS CONTINUES BELOWSo these daily MACD crossovers have made some pretty big moves this year.
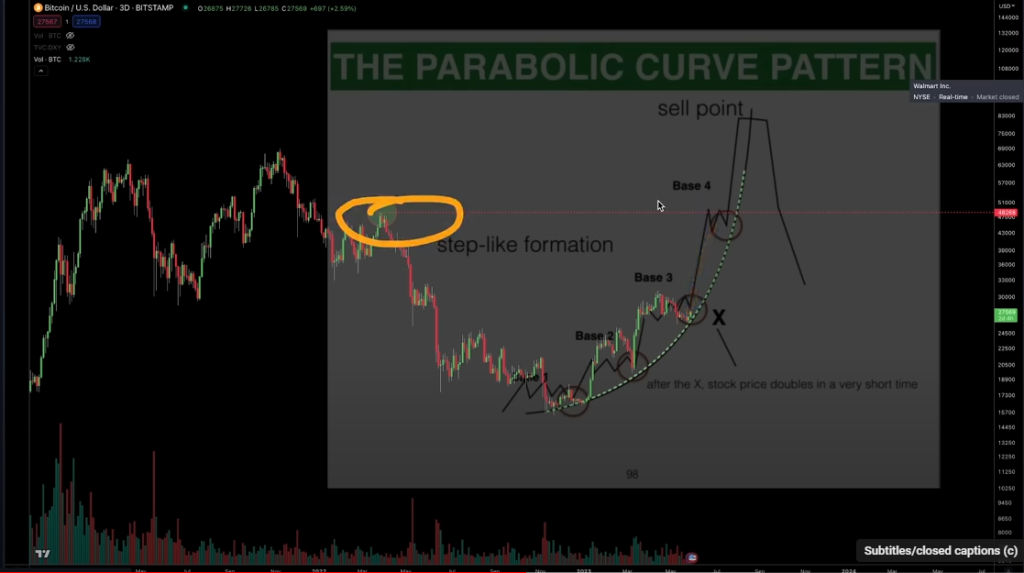
As for his target for a potential Bitcoin surge, Svenson says he’s looking at BTC’s potential parabolic setup. BTC is following the parabolic curve cheat sheet “up to a T,” according to the analyst.
We are currently completing the third base. We had base one, we had base two, and now we’re at base three. And the third base is nearing completion at the very edge of the parabolic curve. We have to bounce here to maintain the parabolic curve. What this diagram suggests is that the next move will actually save us over $48,000.
You can follow the current price action here.