
bitcoinWhile the rise of ‘s yesterday increased the interest of investors in BTC, an analysis came from experienced analyst Peter Brandt.
bitcoinSaying that an ascending triangle formation was formed in , the analyst compared the current model with a similar movement in 2019.
Current Bitcoin chart as per Peter Brandt:

Stating that Bitcoin exhibited a similar movement in 2019, the analyst said, compare it with the current table.
2019 example:
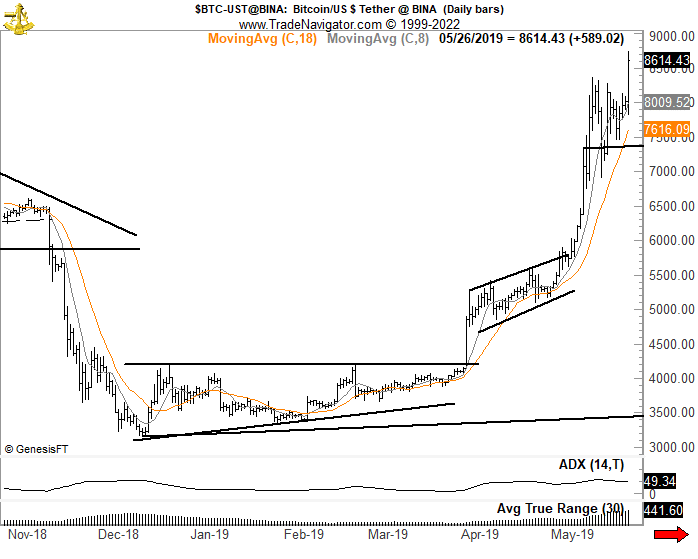
When we examine Brandt’s 2019 example, after breaking up of the ascending triangle We see that Bitcoin has entered a sharp rise and has increased by almost 100% in a short time.
Our encounter with a similar picture may cause many investors to close their losses.
If the ascending triangle pattern outlined by Brandt works, we would expect an increase in price by the height of the triangle. This signals us that we can see an increase up to the $63,500 levels.
We will follow the weekly ma20 and ma50 ($44500 region) as support in the major and continue to look at the market positively as long as we stay above these levels.
Brandt Warns
A warning came from Brandt, who drew attention to the similarity between the two graphics. The experienced analyst said:
“Graphs do not predict the future. The charts don’t even offer possibilities. Charts suggest probabilities and are useful in managing the risks in a trade. Patterns on the chart can work, fail, or change into something different. Watch out if the laser eyes reappear and Bitcoin’s rise stops.”