
In crypto markets, where price predictions increase, the importance of technical analysis and indicators has become more prominent. Analyst Benjamin Cowen also made a remarkable observation, using one of his technical analysis tools to examine the price movements of major cryptocurrencies such as Bitcoin (BTC) and predict potential future movements.
Benjamin Cowen said that Bitcoin has formed a “golden cross” formation that has signaled decline in the past.
The golden cross or “Golden Cross” is considered a widely used indicator in technical analysis. This indicator examines the relationship between an asset’s short-term 50-day moving average (MA) and its long-term 200-day moving average. A golden cross occurs when the 50-day MA crosses or crosses the 200-day MA from top to bottom. A golden cross is often interpreted as a bullish signal that the price of an asset will potentially increase. This is a positive sign for investors and analysts and may indicate a period when the price may begin to rise.
However, Benjamin Cowen draws attention to an interesting point when he examines the performance of this indicator over history in the case of Bitcoin. According to Cowen, although Bitcoin has historically experienced large price increases after seeing the golden cross, these increases have been followed by frequent corrections and price pullbacks. So, although this indicator for Bitcoin seems like the beginning of an uptrend, it implies that investors should be careful after this rise.
“By chance, we came across a golden cross where 50 days crossed over 200 days. And what history shows us after the golden cross formation is that normally you go down first.
Historical data does not mean this should happen. There are periods in history when the price decreases after a death cross or when the price rises after a golden cross formation. But if we are talking about the death cross and how the price normally rises in the short term after the death cross, I would like to point out that at least we now have a golden cross formation, but this does not necessarily mean anything.
This tells you something you already know: The price has increased a lot and therefore the short-term moving average is above the long-term moving average.
And the last time we saw the golden cross pattern was in February, and after that golden cross you can see the price dropped around 8% or 9%. For reference, an 8% or 9% drop from these levels would take Bitcoin to around $31,000.”
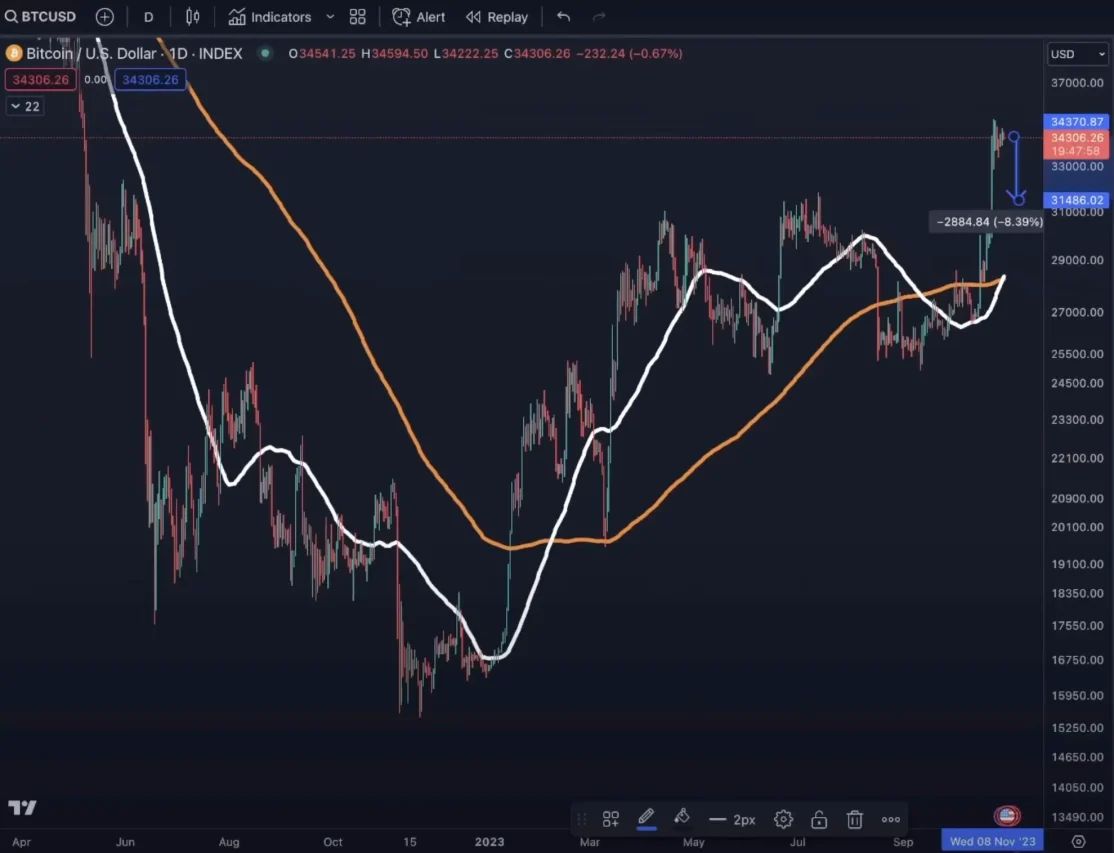
Koinfinans.com According to Cowen, as we reported, the more important issue is whether Bitcoin will maintain $ 31,000 as support if it shows a downward trend.
“I think the more important thing is that if Bitcoin does experience a pullback, assuming it does at some point, this area (at $31,000) will of course be what everyone will be watching.”
Bitcoin is trading at $34,346 at the time of writing this article.
You can follow the current price movement here.