Popular cryptocurrency analyst TechDev, Bitcoin A bullish signal appears on the chart, which is quite rare and usually correct. stated.
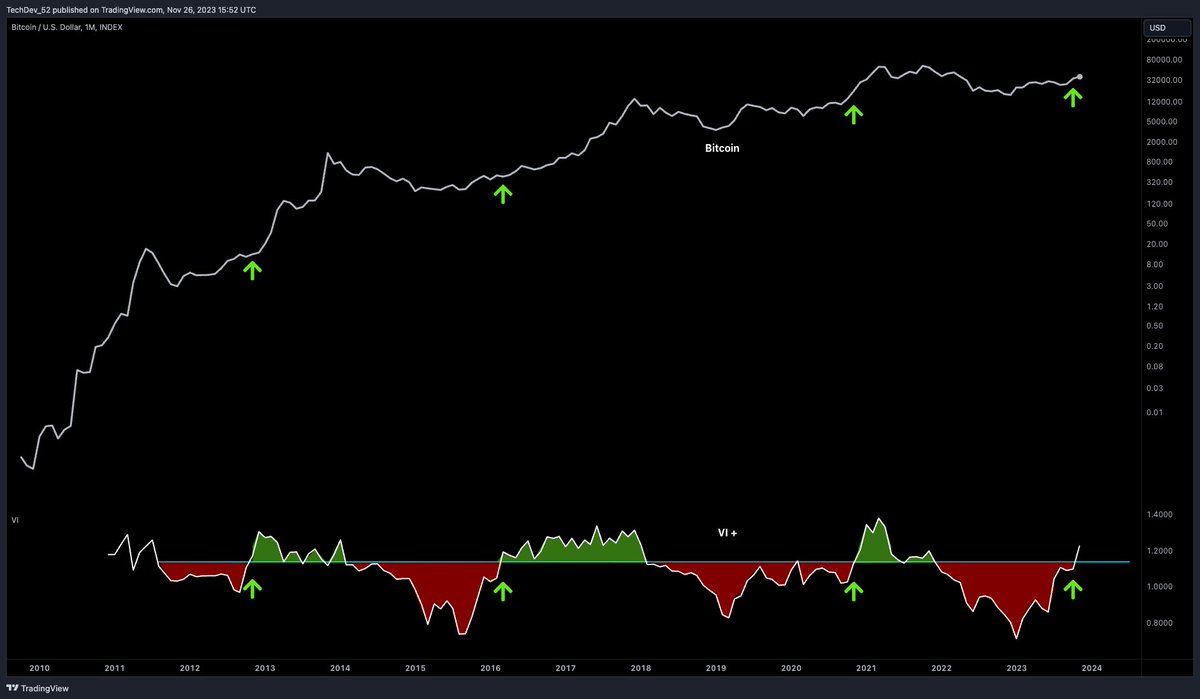
TechDev stated that the indicator known as the “Vortex Indicator (VI)” once again points to a ‘bull run’.
VI is used in technical analysis to detect trend reversals and confirm existing trends. According to the analyst’s monthly BTC chart, the VI indicator correctly detected the beginning of the bull market in the previous three instances and has now turned bullish for the fourth time.
The analyst also noted that another bullish metric for Bitcoin is the recent strong performance of the Dow Jones Industrial Average (DJI).
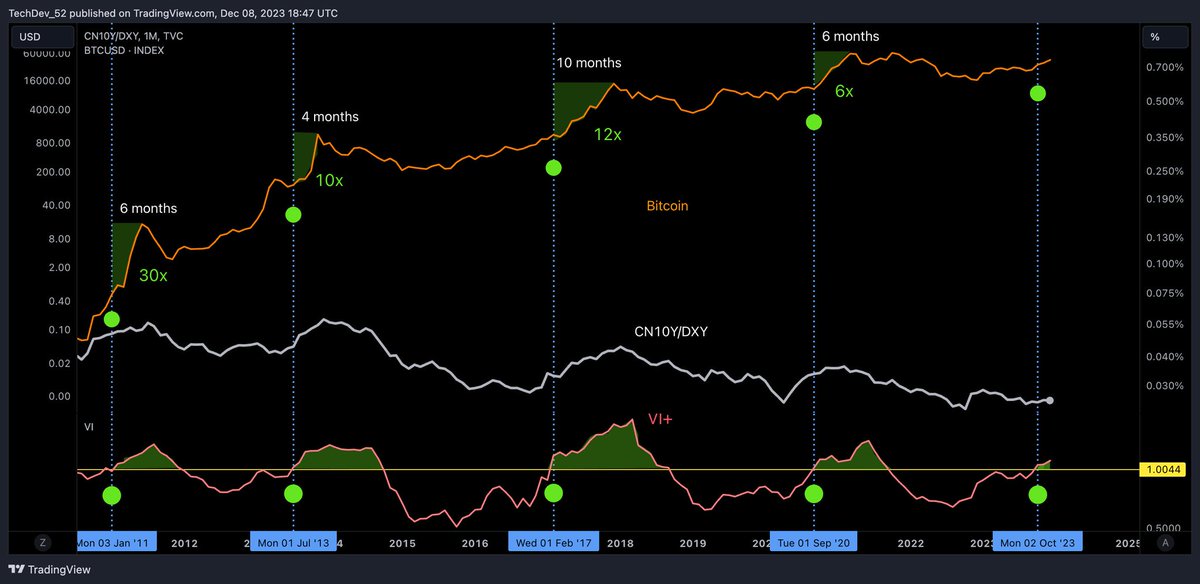
The chart he shared includes a measure of China’s 10-year bond yield against the US dollar index (CN10Y/DXY) to show Bitcoin’s cyclical patterns of global liquidity that overlap with market cycles.
The analyst’s chart shows that global liquidity is currently on the rise and suggests Bitcoin could follow suit, as it did in 2011, 2013, 2017 and 2020.