It turned out that today’s price action, along with the values of the indicators on the 5-day time frame, also give conditions similar to the historical signals of a strong Bitcoin movement. Recently, well-known cryptocurrency analyst Eric Krown took a look at this development on YouTube. According to the expert, if the market behaves as it has for the past 12 months, the BTC price could reach the $61,000 area in about 42.5 days.
How is the Bitcoin price moving?
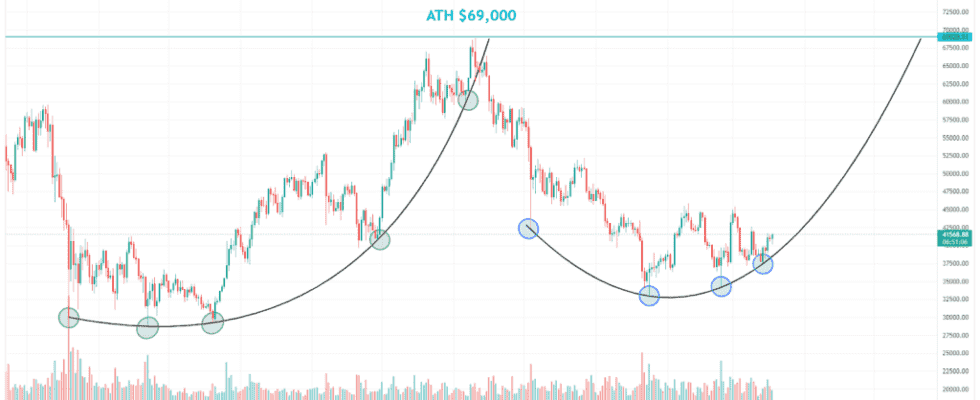
Bitcoin reached an all-time high of $69,000 on November 10, 2021. After that, the price fell for the next 75 days, reaching the bottom at $33,000 on January 24, 2022. BTC is down 52 percent since ATH. Since the January low, BTC has been trending sideways with price consolidation and higher lows on the daily chart. For the past month and a half, Bitcoin has been in a range between $37,500-$44,500.
If we look at the price action of BTC over the past 12 months, we can see some similarities with the trend reversal following the summer 2021 low macro. It initially set support points (green circles) during the May-July 2021 low and then acted as support during the September correction. Only a definitive break below this curve and confirmation as resistance on Nov. 12-15 started a sharp decline in BTC.
What does BBWP show for BTC?
Bollinger Band Width Percentage (BBWP) is a derivative of the Bollinger Band indicator. Second, it is a volatility-based indicator. It consists of three lines drawn according to the price of an asset. The middle line is usually a simple moving average. The upper and lower bands are usually within 2 standard deviations above and below the midline.

BBWP shows the percentage of bars in a given time frame where the Bollinger Band width is less than the current Bollinger Band width. In other words, the BBWP displays a graph of an asset’s volatility relative to previous price movements. Last year saw an interesting pattern on the 5-day BBWP chart for Bitcoin. Since January 2021, BBWP has periodically bottomed out by a few percent and Bitcoin’s volatility has been falling.

Strong moves for Bitcoin: $61,000 forecast in April
Each of these lows on the BBWP chart was followed by a rapid expansion phase in Bitcoin’s volatility within days. As volatility is directionally neutral, the next few days always led to big ups and downs. It just marks a big change in price. Also, the BBWP chart points to a global drop in Bitcoin’s volatility over the past year.

At the same time, according to the expert, we can expect a very strong move in BTC in the next few months when the BBWP resistance line is broken. Now, when we look at the price action in the periods following consecutive decreases in BBWP, the range of corresponding increases and decreases can be seen. By measuring the movement of BTC price to the local high/low with the 5-day candle open at the time of the signal, the following results are obtained:
- 50% drop lasting 45 days
- 55% increase lasting 40 days
- 45% increase lasting 35 days
- 42% drop lasting 50 days

By averaging these data, we get an average of 48 percent volatility for the Bitcoin price. On the other hand, the average time from signal to high/low transition is 42.5 days. The opening price of the most recent 5-day candle is $41,100. According to the expert, if the next high/low average period is maintained, a target of 48 percent will be achieved in the last days of April. So according to the expert, if BTC were bullish, a 48 percent increase from the current opening candle, BTC would have been priced around $61,000 in April. Had there been a 48 percent drop, BTC would have been priced around $21,400.
Contact us to be instantly informed about the last minute developments. twitter‘in, Facebookin and InstagramFollow and Telegram and YouTube join our channel!

Disclaimer: The articles and articles on Kriptokoin.com do not constitute investment advice. Cryptokoin.com does not recommend buying or selling any cryptocurrencies or digital assets, nor is Kriptokoin.com an investment advisor. For this reason, Kriptokoin.com and the authors of the articles on the site cannot be held responsible for your investment decisions. Readers should do their own research before taking any action regarding the company, asset or service in this article.
Warning: Citing the news content of Kriptokoin.com and quoting by giving a link is subject to the permission of Kriptokoin.com. No content on the site can be copied, reproduced or published on any platform without permission. Legal action will be taken against those who use the code, design, text, graphics and all other content of Kriptokoin.com in violation of intellectual property law and relevant legislation.