Tony “The Bull” (@tonythebullBTC), known as one of the leading analysts of the cryptocurrency market, recently offered investors a remarkable perspective with his XRP analysis. In this analysis, he evaluated the future performance of XRP, focusing specifically on Bollinger Bands indicators. Here are the details…
The analyst expects an increase in the future price movements of XRP and expresses this optimism with three basic signals. supports. Here are these signals that Tony mentioned:
- The Width of the Bollinger Band is the second narrowest ever recorded.
- Bollinger %B is above 0.5, indicating bullish price action.
- XRP’s price could potentially break through the upper Bollinger Band. The analyst sees XRP closing above this level as a buy signal.
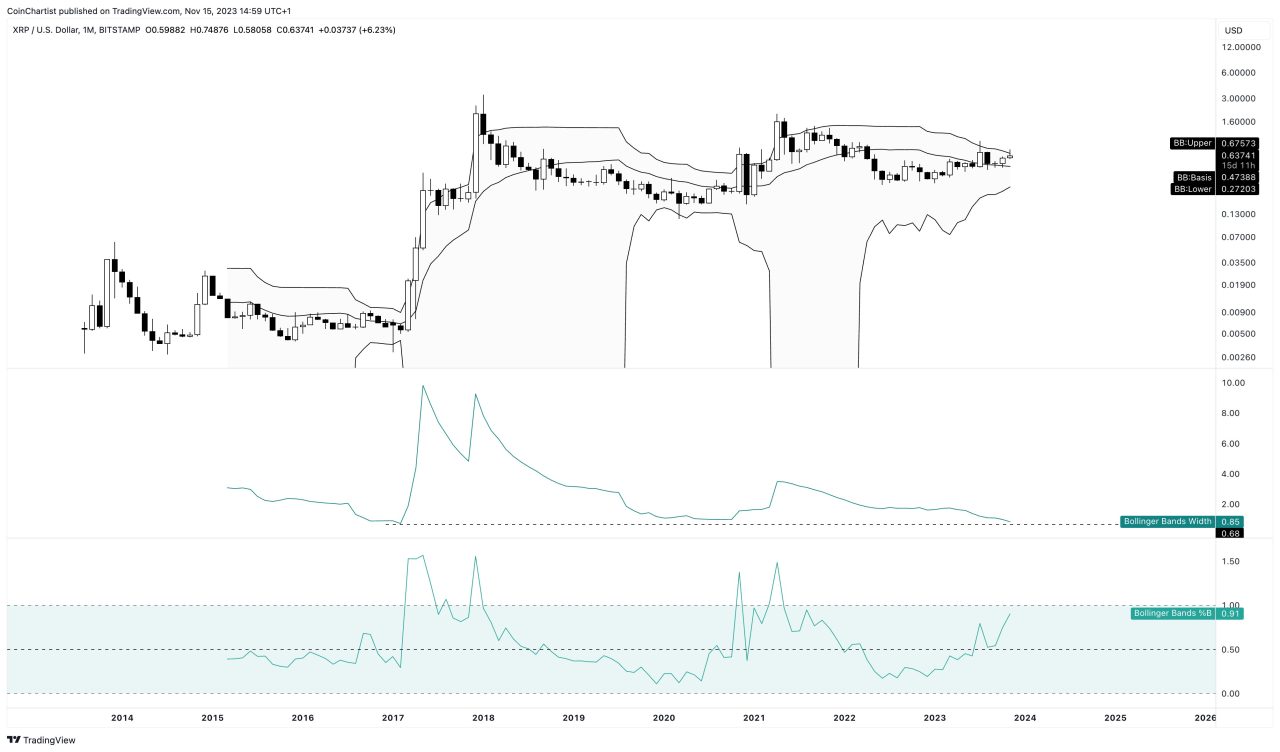
Tony first highlighted in his analysis of the width of Bollinger Bands (BBW) that the width is the second narrowest ever recorded. This usually means that market volatility is low and a significant change in price movements is approaching. Investors may consider this contraction as a harbinger of the next big price move.
Historically, such low BBW levels have followed periods of low volatility followed by significant price increases. The last example of similar BBW levels occurred in October 2020, leading XRP to rise to $1.96 in April 2021. The chart also shows that the tightest BBW in XRP history was recorded just before the digital asset surged to its all-time high in January 2018.
Another important point in the analysis is that Bollinger %B is above 0.5. This indicates that the price is closer to the upper Bollinger Band and usually indicates a bullish trend. Investors can consider this as a positive indicator that increases the likelihood of the price rising. Currently standing at 0.91, B% rose above 0.5 for the first time since November 2020. Historical data is also compatible with this model. This increase in B%, which has remained below 0.5 since April 2022, indicates a potential shift in market sentiment.
Finally, Tony predicted in his analysis that the price of XRP could potentially break through the upper Bollinger Band. This is considered an important turning point in technical analysis. The chart shows the upper Bollinger Band at $0.67573. At the time of Tony’s analysis, XRP was trading at $0.63741 and is currently at $0.6122.
Koinfinans.com As we reported, Tony predicts that closing above this upper band will trigger a buy signal that will herald a long-awaited shift in the market. Historical data shows that such breakouts often signal important turning points in the XRP price trajectory.
In summary, Tony “The Bull” thinks that with the combination of these three basic signals, the XRP price may initiate a significant rise in the coming period. However, as with all investments, caution should be exercised when investing in cryptocurrencies. Market fluctuations and risks should always be taken into consideration, and investment decisions should be made in accordance with personal financial goals and risk tolerance.
You can follow the current price movement here.