
Polkadot The price turned a key EMA line as support and managed to break above a short-term formation. The price has a range to continue rising in the near future.
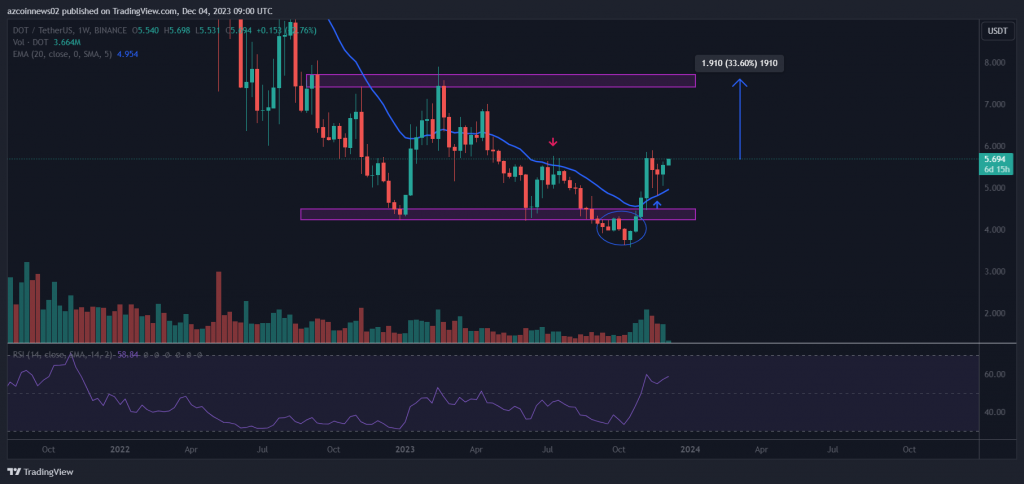
Polkadot priceThe price has rallied since September 4 to October 23, 2023 (green ellipse) since it created bullish divergences below the key $4.3 support zone. These divergences are also referred to as bear traps and are usually followed by very strong upward movements.
In fact, the DOT price broke above the 20-week EMA, confirming it as support during the week of November 20-26 (green arrow). This is a bullish development because the 20-week EMA often acts as an important support in an uptrend. This indicates a shift in sentiment from selling during an uptrend to buying during a downturn and provides a clearer outlook on the weekly timeframe.
The weekly RSI is rising and above 50, supporting the continuation of the uptrend. Therefore, DOT price is likely to continue rising towards the next major resistance zone at $7.6, up 33.66% from the current level.
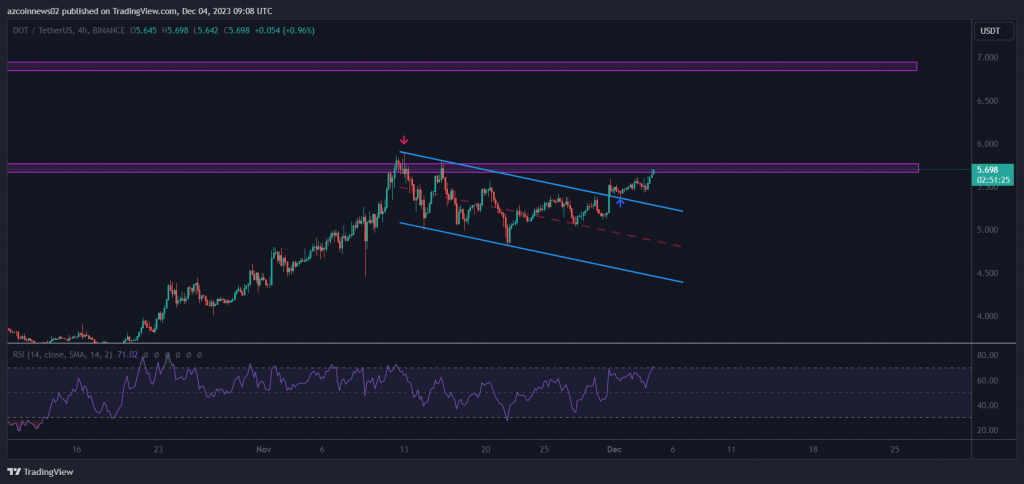
The 4-hour chart supports the bullish perspective on the weekly time frame. It shows Polkadot price breaking above a descending parallel channel that formed after rejection from the $5.7 resistance zone (red arrow) on November 12.
This indicates that the short-term correction has ended and DOT has started a new uptrend. In fact, the DOT price confirmed the resistance line of the channel as support on December 1 (green arrow). The 4-hour RSI is above 50 and sloping upwards, indicating that the advantage lies with the bulls.
Therefore, DOT price could rise above the $5.7 resistance zone and rise to the next resistance at $6.9.
The most likely scenario shows that the price of DOT will continue to rise in the near future. The immediate target is $6.9, with the higher target at $7.6.