
Sui The price was rejected at the resistance zone at the all-time high and fell below a short-term formation. This increased the expectation that the price would undergo a correction soon.
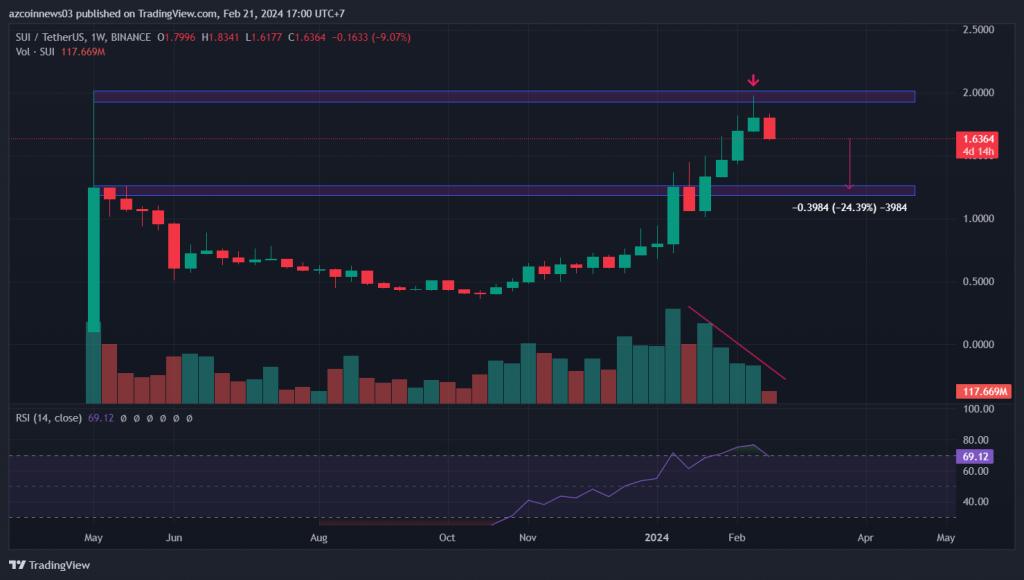
The price broke above the key horizontal resistance zone at $1.25 during the week of January 22-28, 2024, and attracted the spotlight last week by reaching an all-time high of $2.
However, the weekly candles after the breakout all had long upper wicks and volume gradually decreased. This can be interpreted as some indicators that the power of the altcoin is decreasing.
As we reported as Koinfinans.com, SUI price was rejected by the resistance zone at $2, which was its all-time high last week. The weekly RSI is below 70 and is sloping downwards, which can be interpreted as another sign of weakness. As a result, if the price continues to fall, the first support zone is located at $1.25, representing a 25% decline.
The daily chart indicates more bearish signals compared to the weekly time frame.
Over the past two days, SUI price broke below the short-term ascending wedge formation and the horizontal support zone at $1.7. This means the bears have regained control in the short term.
The daily RSI has broken below the ascending support trend line and is sloping downwards, supporting further declines. Therefore, the price might drop to the $1.40 support zone in the coming days.
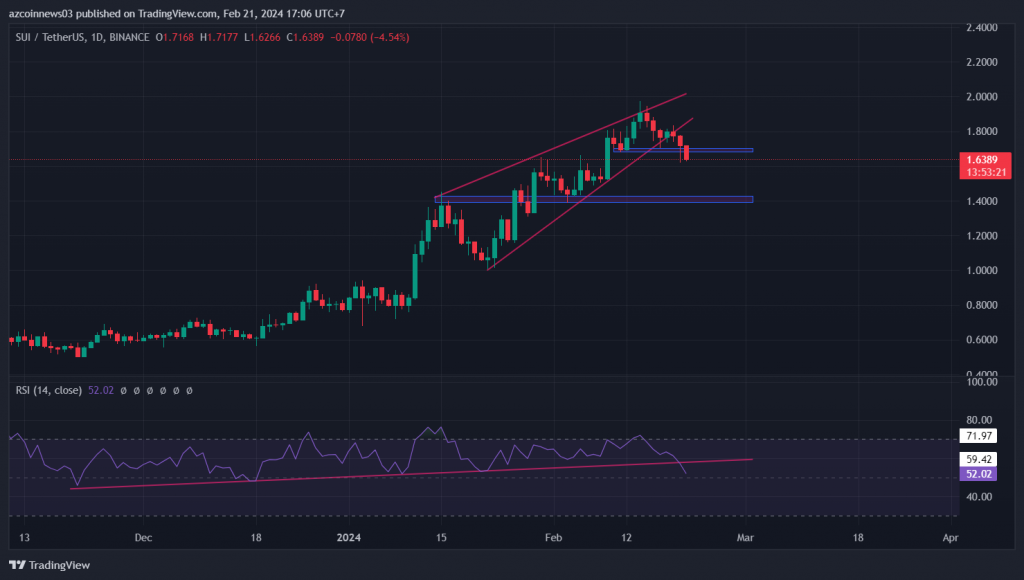
The most likely scenario suggests that the SUI price will experience a correction in the near future. The nearest target is $1.40 and a potential decline towards $1.25.
The bearish view will be invalidated if SUI breaks the resistance zone above $2.
