
Bitcoin attempted to break out of the tedious sideways price action on July 13 after Ripple’s legal victory over the United States Securities and Exchange Commission, but the enthusiasm proved short-lived. Sellers pulled the price back into the range on July 14, showing that they remain active at higher levels. However, it is a positive sign that the bulls are holding the price of Bitcoin above $30,000. Market watchers are expected to closely monitor the review process of various exchange-traded fund (ETF) offers for the spot Bitcoin ETF, one of the most notable of which is BlackRock’s offering. Interestingly, only one of the 550 ETF applications filed by BlackRock was rejected, according to Eric Balchunas and James Seyffart of Bloomberg Intelligence. Even as Bitcoin consolidates and awaits its next catalyst, a few altcoins are witnessing solid buys. Here are the altcoins to watch out for, according to analyst Rakesh Upadhyay…
Bitcoin price analysis: What’s next in the leader coin before altcoins?
Bitcoin closed above $31,000 on July 13, but this proved to be a bull trap as the bears pushed the price back below the level on July 14. This shows that the bears are fiercely defending the region between $31,000 and $32,400. The price action of the last few days has created a bearish divergence in the relative strength index (RSI). This indicates that the bullish momentum is weakening. The bears will try to leverage their advantage by pulling the price below the 20-day exponential moving average ($30,187). If they do, the BTC/USDT pair could slide down to the 50-day simple moving average ($28,631).
If the bulls want to block the decline, they will need to quickly push the price above $31,000 and sustain it. The pair could climb to $32,400 later. A break and close above this level would open the way for a potential run to $40,000 as there is no major resistance in between. The pair dipped below the moving averages on the four-hour chart, which suggests demand is drying up higher. The bears will need to push and sustain the price below $29,500 to start a deeper correction. The pair could decline to $27,500 later.

Alternatively, the bulls will need to push and sustain the price above $31,000 to start a bullish move towards $32,400. If the price drops from $32,400 but recovers from $31,000, it will indicate that the bulls have turned the level to support. The pair could then start a rally towards $40,000.
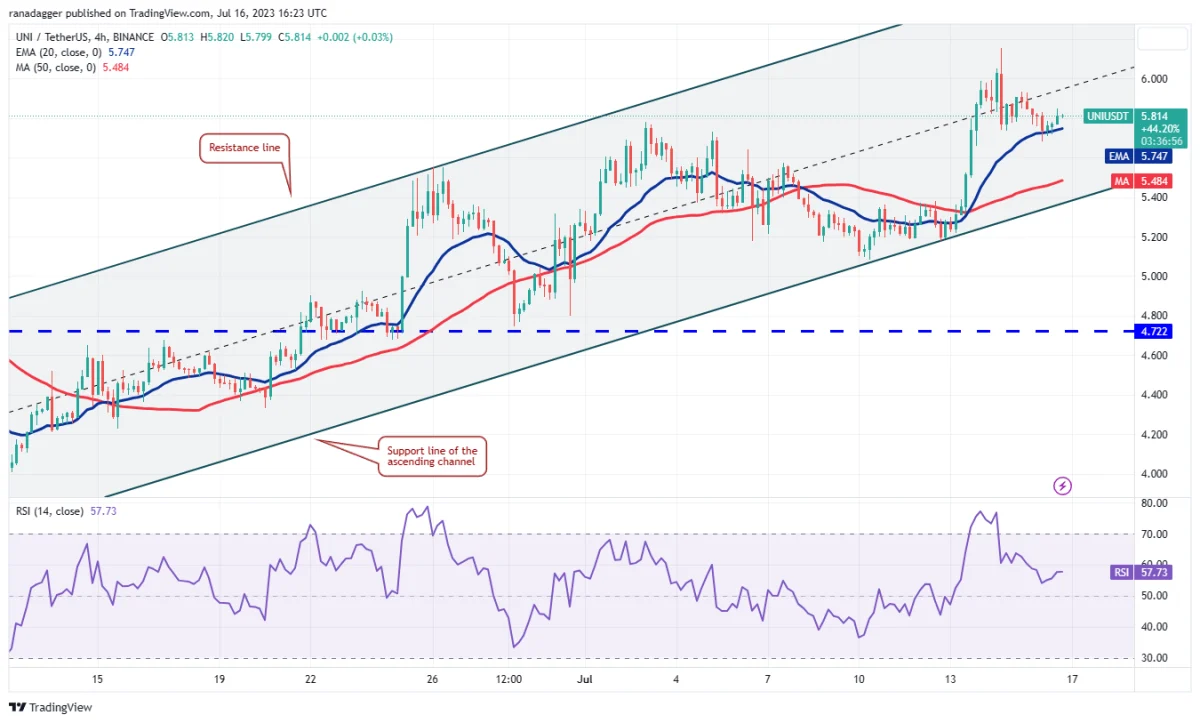
Uniswap price analysis
Uniswap holds support from the 20-day EMA ($5.41) during pullbacks, which indicates that sentiment has turned positive and traders are buying the dips. The bulls will try to buy the current decline and push the price above the immediate resistance at $6.16. If they manage to do so, the UNI/USDT pair could rise as high as $6.50. This level could act as a strong resistance again, but if the bulls do not leave much ground, the pair could reach $6.70.

Important support to watch on the downside is the 20-day EMA. A break and close below this level will indicate that the bears are back in the game. The pair could then decline to the 50-day SMA ($5) and then to the key support at $4.72. The correction on the four-hour chart has reached the 20-day EMA. This is the first major boost to look out for. If altcoin price recovers from this level, the pair could retest the overhead resistance at $6.17. Above this level, the pair could climb to the resistance line of the ascending channel. On the contrary, if the price drops below the 20-day EMA, it will indicate that short-term traders are able to book profits. This, in turn, may pull the price to the support line of the channel. If this level is broken, the pair could drop to $5.08.
Arbitrum price analysis: What’s next for the altcoin?
Altcoin Arbitrum (ARB) broke the symmetrical triangle pattern on July 15 and closed above it, suggesting that the bulls have prevailed over the bears. The 20-day EMA ($1.16) has turned up and the RSI is approaching the overbought zone, indicating that the path of least resistance is to the upside. A minor resistance is at $1.36, but if this level is surpassed, the ARB/USDT pair could rise as high as $1.50. This level could again pose a strong challenge, but if the bulls overcome it, the rally could be extended to $1.70.

This positive view will be invalidated in the near term should the price decline and break below the support line of the triangle. This could trap a few aggressive bulls and cause a sharp drop to $0.90. The bulls have successfully retested the level of the breakout from the symmetrical triangle, which shows that lower levels are attracting buyers. The bulls will attempt to build on this strength by pushing the price above $1.36. If they are successful, the pair could gain momentum.

Conversely, if the price turns down from the current level or $1.36, the bulls will try to drag the pair back into the triangle. If they do, it will indicate that the recent breakout could be a bull trap. The pair could then drop to the 50-day SMA and then to the support line of the triangle.
Aave price analysis
Aave broke support and closed above descending channel pattern on July 3. The bulls successfully retested the breakout level on July 6 and July 10. This shows that the bulls have turned the resistance line into support. The rising 20-day EMA ($72) and the RSI in the positive zone indicate that the bulls are in command. If the price turns up from the current level or bounces off the 20-day EMA, it will increase the likelihood of a rally above $84.50. The AAVE/USDT pair could then rise as high as $95.

Contrary to this assumption, if the price drops and breaks below the 20-day EMA, it will indicate that the bulls may be losing control. The bears will then try to pull the price back into the descending channel. The four-hour chart shows that the bulls pushed the price above the overhead resistance of $84.50 but were unable to sustain the breakout. The bears sold higher and pushed the price back below the 20-day EMA. Both moving averages have flattened out and the RSI is near the midpoint, suggesting a balance between supply and demand.

Maker price analysis
Maker crossed the downtrend line on July 2 and successfully retested that level on July 14. A bounce from this support indicates strong demand at lower levels. The rising 20-day EMA ($878) and the RSI in the positive zone indicate that the bulls are in control. Buyers are trying to continue the upside move but they may face stiff resistance near $1,100. If the bulls break this hurdle, the MKR/USDT pair could rise as high as $1,200.

Conversely, if the price turns below $1,080, it will indicate that the bears continue to sell in the rallies. The pair could then drop to the 20-day EMA. A break below this level will indicate that the bears are trying to make a comeback. The four-hour chart shows that the bulls are pushing the price above the resistance line and the short-term correction may be over. The price could drop to the resistance line, which is an important level to consider.

A strong rebound from this level will indicate that the bulls have turned the resistance line to support. This will increase the probability of a move above $1,080. This positive view could be invalidated in the near term if the price drops below the moving averages. This could bring the pair down to $831.
Contact us to be instantly informed about the last minute developments. twitter‘in, Facebookin and InstagramFollow and Telegram And YouTube join our channel!
Risk Disclosure: The articles and articles on Kriptokoin.com do not constitute investment advice. Bitcoin and cryptocurrencies are high-risk assets, and you should do your due diligence and do your own research before investing in these currencies. You can lose some or all of your money by investing in Bitcoin and cryptocurrencies. Remember that your transfers and transactions are at your own risk and any losses that may occur are your responsibility. Cryptokoin.com does not recommend buying or selling any cryptocurrencies or digital assets, nor is Kriptokoin.com an investment advisor. Therefore, Kriptokoin.com and the authors of the articles on the site cannot be held responsible for your investment decisions. Readers should do their own research before taking any action regarding the company, assets or services in this article.
Disclaimer: Advertisements on Kriptokoin.com are carried out through third-party advertising channels. In addition, Kriptokoin.com also includes sponsored articles and press releases on its site. For this reason, advertising links directed from Kriptokoin.com are on the site completely independent of Kriptokoin.com’s approval, and visits and pop-ups directed by advertising links are the responsibility of the user. The advertisements on Kriptokoin.com and the pages directed by the links in the sponsored articles do not bind Kriptokoin.com in any way.
Warning: Citing the news content of Kriptokoin.com and quoting by giving a link is subject to the permission of Kriptokoin.com. No content on the site can be copied, reproduced or published on any platform without permission. Legal action will be taken against those who use the code, design, text, graphics and all other content of Kriptokoin.com in violation of intellectual property law and relevant legislation.