
Bitcoin, which has been in a declining period since November, has lost 55% of its value since the beginning of the year, while it has lost 28% in the last 30-day period.
In this article, we have examined some indicators for you.
Logarithmic MACD (LMACD) / Weekly
On Bitcoin’s 1-week chart, the LMACD indicator has detected almost all reversal zones. of bitcoin at $19k Bitcoin price after the blue line representing the 26-week moving average crossed the red line representing the “top” 9-week moving average, giving a warning It was down to $3,000.. Then, on the return of 3 thousand dollars, the blue line gave the signal that it would rise by cutting the red line “from the bottom” this time.
In the decline that started from the levels of 69 thousand dollars, blue and red line warning but there is no indication according to the indicator that the turn has started at the moment.
Supertrend / Weekly
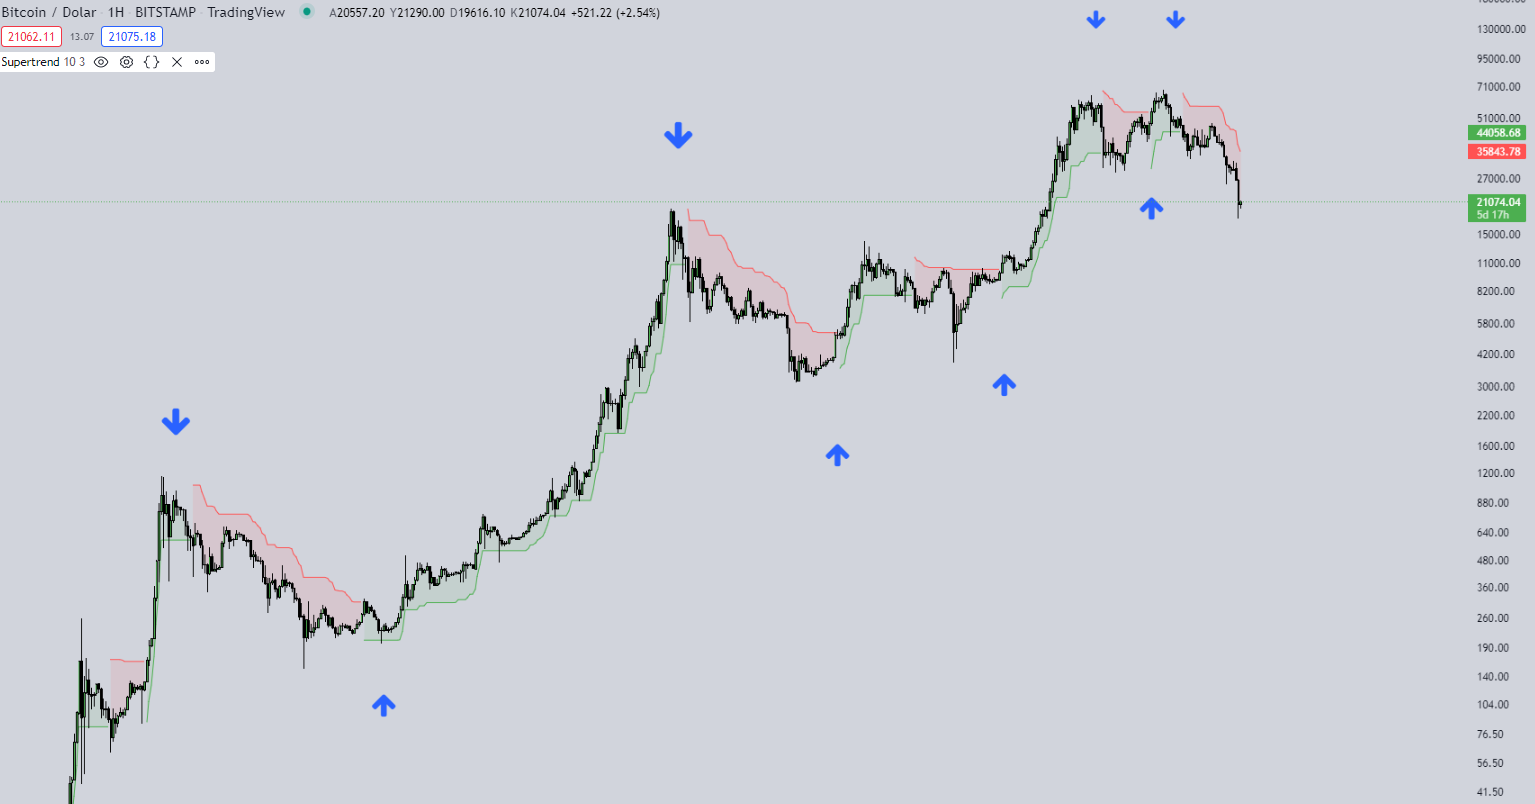
No trading should be based on indicators alone, but it can be checked to see if they match our ideas. Even if the Supertrend indicator seems to predict the reversal zones in the weekly period, the daily and Doesn’t work that efficiently in the 4 hour period.
Currently any turn signals such as LMACD on this indicator didn’t give. In order for us to talk about the rotation according to the indicator, turn green we have to wait.
Stoch RSI / Weekly
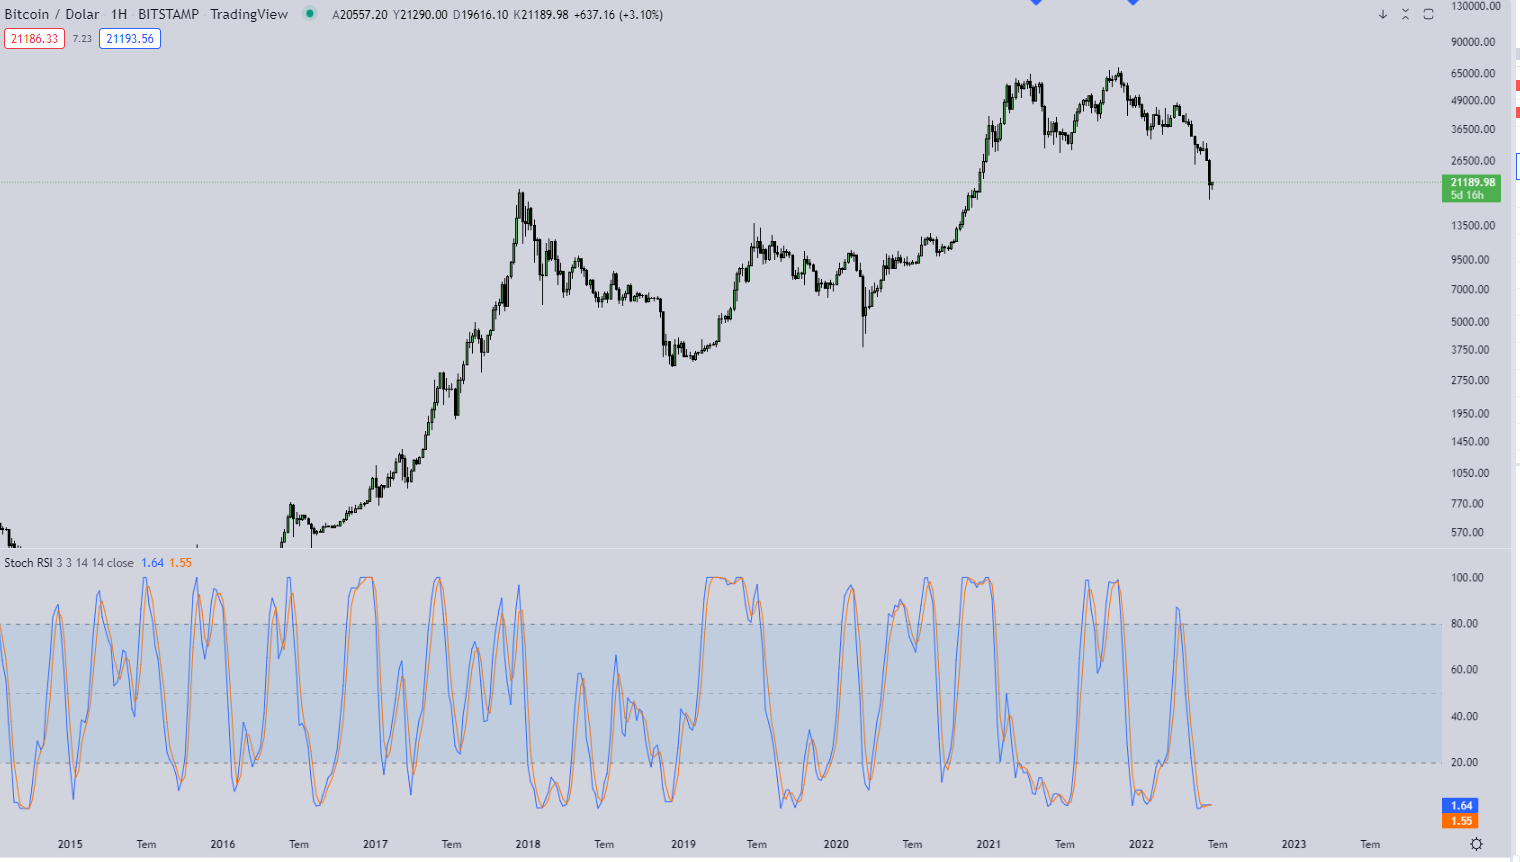
The Stoch RSI, which is thought to know almost all turning points, not just for the bear and bull seasons, is giving a different view of the indicator known as the Relative Strength Index (RSI). It is also interpreted according to the movements of the blue and red lines. End in 14 periods Stoch RSI is available as (Current RSI – Lowest RSI) / (Highest RSI – Lowest RSI).
When the lines are below the specified region, it is thought that the blue line cutting the red line from the bottom will bring an increase, while the blue line crossing the red line above the region indicates that there will be a decrease.
In the current situation, if the Bitcoin price rises a little more and there is a weekly close, the blue line we can see it will cut the red line from the bottom. Even if it is wrong to take action according to this situation, you can look at the indicator as an idea based on your previous actions.
- All data contained in the content is for informational purposes only. It does not contain any investment advice. The authors of the article cannot be held responsible for your investment decisions. In addition, every investment and trade movement carries risk. That’s why you need to do your own research when investing.